Download
1 / 24
240 likes | 347 Vues
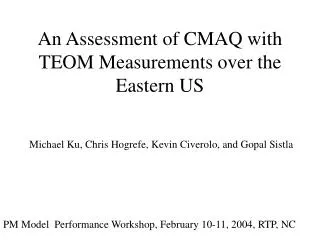
An Assessment of CMAQ with TEOM Measurements over the Eastern US. Michael Ku, Chris Hogrefe, Kevin Civerolo, and Gopal Sistla. PM Model Performance Workshop, February 10-11, 2004, RTP, NC. Model Simulations. MM5 – 108/36/12 km two-way nesting. SMOKE – 1996 CSA emission inventory.

E N D
An Assessment of CMAQ with TEOM Measurements over the Eastern US Michael Ku, Chris Hogrefe, Kevin Civerolo, and Gopal Sistla PM Model Performance Workshop, February 10-11, 2004, RTP, NC
Model Simulations • MM5 – 108/36/12 km two-way nesting. • SMOKE – 1996 CSA emission inventory. • CMAQ – 12 km domain only; both CB-IV and RADM2; IC/BC used background values. • Simulation Period – July 2 – August 1, 1999
TEOM Measurements 21 sites include SLAMS, USDOE, NEOPS, and SEARCH.
Model Evaluation • Examine the Model Error • Examine the Model skill -- Compare the spatial structures -- Compare the temporal patterns
CMAQ (CB-IV) predicts slightly higher daily averaged values than CMAQ (RADM2).
CMAQ (CB-IV) underpredicted low-end and overpredicted high end of the daily averaged values.
CMAQ (RADM2) underpredicted low-end and overpredicted high end of the daily averaged values.
Compare Spatial Structures • Calculate Cross-correlation coefficients of TEOM • measurements and CMAQ outputs at the TEOM • sites. The calculations yield a 21x21 symmetric • matrix of correlation coefficients which represent • the correlation of the sites with each other. • If CMAQ produces similar correlation coefficients • matrix with TEOM, the CMAQ is able to capture • the TEOM measured spatial structures.
The similarity of the two contour plots indicates that CMAQ (CB-IV) is able to capture the spatial pattern of the TEOM measured data
Compare Temporal Patterns • Hourly time series • Synoptic components • Diurnal variation
Examine the Synoptic Components • KZ filter is used to extract the Synoptic Components from TEOM measurements and CMAQ predicted data. • Compare the Synoptic Components for data averaged over three regions: Iowa, Northeast, and SEARCH.
Diurnal variation: Examples of good hourly time series comparison.
Diurnal variation: Examples of poor hourly time series comparison.
SUMMARY • CMAQ overpredicted TEOM measurements at high end and underpredicted at low end. • CMAQ captured the spatial pattern of the TEOM measurements. • TEOM measurements and CMAQ predictions show no typical diurnal variation. • CMAQ performed well in capturing the average synoptic temporal pattern in the northeast region, but failed to capture the temporal pattern in the other two regions. • Analysis should be expanded to include PM speciation data.