Download
1 / 89
890 likes | 1.06k Vues
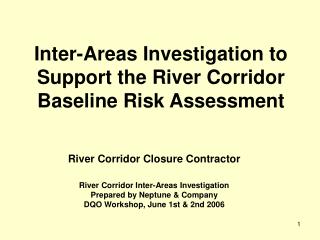
Inter-Areas Investigation to Support the River Corridor Baseline Risk Assessment. River Corridor Closure Contractor River Corridor Inter-Areas Investigation Prepared by Neptune & Company DQO Workshop, June 1st & 2nd 2006. Inter-Areas Investigation Workshop Topics. Introduction and schedule

E N D
Inter-Areas Investigation to Support the River Corridor Baseline Risk Assessment River Corridor Closure Contractor River Corridor Inter-Areas Investigation Prepared by Neptune & Company DQO Workshop, June 1st & 2nd 2006
Inter-Areas InvestigationWorkshop Topics • Introduction and schedule • Project purpose and scope • Proposed approach • Data evaluation • Ecological DQOs • Human health DQOs • Proposed sample locations
Introduction and Schedule Inter-Areas Investigation
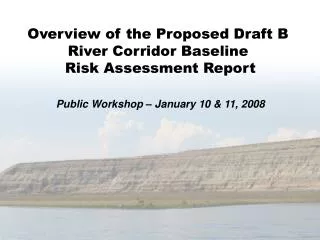
Purpose Statement Inter-Areas Investigation Evaluate risks from chemicals and radionuclides between source or operational areas (reactor and industrial) in the 100 Area and 300 Area riparian and near-shore aquatic environs.
Purpose • Extension of 100/300 Area RCBRA • Fill contaminant data gaps for non-operational areas • Supplemental environmental data collection for 100/300 Area RCBRA • Benefit from stakeholder input, assessment approaches, and data • 100-B/C Pilot • 100-NR-2 • 100/300 RCBRA
Scope Additional considerations for Inter-Areas: • Consider all salmon spawning areas • Consider cumulative exposures to wide-ranging species • Consider multi-media exposures • Current concentrations from 200 Area groundwater plumes
Scope • Develop 100/300 Area Sampling and Analysis Plan Addendum for Inter-Areas data collection
Inter-Areas Approach • Follow DQOs developed for 100/300 Area riparian and near-shore aquatic regions • Measure contaminants in riparian soil, sediment, water, and biota • Characterize contaminant risks in riparian and near-shore aquatic areas
Inter-Areas Approach • Apply DQOs consistent with 100/300 Area assessment • Contaminant suites • Endpoints and measures for riparian and near-shore aquatic areas • Sampling approaches • MIS riparian soil • Grab sediment • Horizontal aquifer tubes • Biota samples (invert baskets, clam tubes, sculpin, etc.)
Inter-Areas Approach Spatial Areas Considered • Unique habitats • Backwaters • Sloughs • Wetlands • Habitats for species of interest • Salmon spawning habitat • Eagle roost areas • Heron rookeries • Game fish • Mollusks
Inter-Areas Approach Spatial Areas Considered • Emergent 200 Area groundwater plumes in near-shore aquatic areas • Tritium • Nitrate • Areas in context of wide-ranging ecological receptors
Inter-Areas Approach Potential Contaminants • Inorganics • Metals - Method SW-846 • Hexavalent Chromium – Method 7196A • Mercury – Methods 7470/7471 • Nitrate – Method 300.0
Inter-Areas Approach Potential Contaminants • Radionuclides • GEA • Isotopic thorium • Isotopic uranium • Total radioactive strontium • Tritium
Inter-Areas Approach Potential Contaminants • SVOCs • Method 418.1 • WTPH-G, WTPH-D • Method 8270A • PCBs and Pesticides • Methods 8081A and 8082
Inter-Areas Approach • Selecting Assessment Endpoints • Extensive list near shore aquatic COPECs • Plants/invertebrates most directly linked to contaminants • Relative to plants, most COPECs have greater uptake potential in invertebrates • Screening level exposure analysis suggests that invertebrate-eating organisms at greatest risk
Inter-Areas Approach Riparian and Near-shore Aquatic Measures Include • Exposure • Water, sediment, or soil concentrations • Tissue concentrations • Effect • Adverse effect (no effect and lowest effect) levels in water or sediment and food • Tissue concentration-based effect levels • Field surveys • Ecosystem/Receptor characteristics • Habitat types • Physical characteristics (grain size, pH, OM)
Measures Collected in Near-shore Aquatic Areas Substrate Class 1 (fines) Pore water COPECs Sediment COPECs Substrate Class 2 (gravel/cobble) Pore water COPECs Clam tube Rock basket Fish tissue
Data Assessment: Multiple Lines of Evidence • Weight or strength of evidence approach • Information from multiple measures, including: • Exposure • Effects • Ecosystem/receptor characteristics • Lines of evidence for each assessment endpoint evaluated for internal consistency
Evaluation of Existing Data Example sources of existing data for Inter-Areas: • Environmental surveillance reports (compiled in PNNL-SA-41467) • 100-B/C Pilot data • 2003/2004 data collected between the 100-B/C and 100-K Areas • Columbia River Component database
Evaluation of Existing Data Example sources of existing information for Inter-Areas (continued): • Historical radiological surveys • EPA fish contaminant study • Dept. of Health studies • Biological Resource Management Plan (BRMaP)
Evaluation of Existing Data Initial Evaluation of Existing Data: • Chemical and radiological data from PNNL-SA-41467 evaluated • Compared relative concentrations between areas • Compared relative concentrations between tissue types • Summary focused on known shoreline contaminants (e.g., Cr, nitrate, Sr-90, tritium, uranium)
Evaluation of Data Sources Synopsis of PNNL-SA-41467 data: • Focus on key shoreline contaminants in sediment, surface water, and biota • Chromium • Nitrate • Strontium-90 • Tritium • Uranium • Discuss dates and media sampled • What trends do these data show?
Chromium in sediment and water (Source PNNL-SA-41467) Water (ug/L) Sediment (ug/kg) • Small sample numbers at some areas • Water trends consistent with plumes
Strontium-90 in sediment and water (Source PNNL-SA-41467) Sediment (pCi/g) Water (pCi/L) • Consistently sampled at all areas • No trend in sediment levels • Water trends consistent with plumes
Strontium-90 in vegetation (Source PNNL-SA-41467) Aquatic vegetation (pCi/g) Riparian vegetation (pCi/g) • Consistently sampled at most areas • Three higher values in riparian vegetation
Uranium-238 in sediment and water (Source PNNL-SA-41467) Water (pCi/L) Sediment (pCi/g) • Consistently sampled at all areas • Generally higher in sediment and water at 300 Area
Uranium-238 in vegetation (Source PNNL-SA-41467) Aquatic vegetation (pCi/g) Riparian vegetation (pCi/g) • Not consistently sampled at most areas • Generally higher in 300 Area aquatic vegetation
Nitrate in seeps and river water (mg/L) (Source PNNL-SA-41467) • Not consistently sampled at most areas • Measured in water only MCL
Tritium in seeps and river water (pCi/L) (Source PNNL-SA-41467) MCL 300 Energy NW • Sampled at most areas • Measured in water only
Evaluation of Data Sources Synopsis of Columbia River Component (CRC) data evaluation for Inter-Areas: • Focus on key shoreline contaminants in sediment (core and grab samples) and surface water (composite and discrete samples) • Chromium • Strontium-90 • Uranium • Data spanning from 1984 to 2005
Chromium in sediment and water (Source CRC Data Compilation) Water (ug/L) Sediment (mg/kg) • Hanford reach concentrations are greater than upstream and downstream
Strontium-90 in sediment and water (Source CRC Data Compilation) Sediment (pCi/g) Water (pCi/L) • No trend in sediment levels • Water concentrations are greater at the Hanford Site
Total Uranium in sediment and water (Source CRC Data Compilation) Water (pCi/L) Sediment (mg/kg) • Hanford reach concentrations are greater than upstream and downstream
Evaluation of Data Sources Initial conclusions of data evaluation: • Contaminant associations follow expected trends with source areas • Radionuclides generally more commonly sampled than non-radionuclides • Provide some information on expected levels in inter-areas
Data Quality Objectives for Inter-Areas Ecological Data Quality Objectives: • Risk questions • Assessment endpoints • Measures for assessment endpoints • Ecological study design
Data Quality Objectives for Inter-Areas Ecological Risk Questions • Do COPECs in sediment/water affect survival/growth/reproduction of plants or benthic macro invertebrates? • Do COPECs in soil, water, or food affect survival, growth, reproduction, or abundance of amphibians, aerial insectivores, or carnivorous receptors?
Data Quality Objectives for Inter-Areas Ecological Assessment Endpoints • Plants • Benthic macroinvertebrates • Amphibians • Aerial Insectivores • Carnivorous fish, birds, mammals
Assessment Endpoints Trophic Organization Consumers Birds Mammals Fish Reptiles Carnivores Invertivores Birds Amphibians Mammals Invertebrates (filter feeders and detritivorous chewers Fish Omnivores Mammals and shredders) Birds Invertebrates Aquatic Terrestrial Scrapers, grazers Vertebrates Vertebrates Herbivores submerged, emergent grasses, Producers periphyton phytoplankton and floating trees macrophytes Chemical NUTRIENTS (fungi, bacteria) Decomposers Carcasses, plant debris, fecal material, etc.
Deer Mouse Assessment Endpoints Trophic organization Great Consumers Chinook Garter Badger Mammals Blue Birds Fish Reptiles salmon, Snake Heron Carnivores sculpin Woodhouse’s Bat Kingbird Birds Amphibians Mammals Toad Invertivores Invertebrates (filter feeders Clam and and detritivorous chewers Whitefish Fish Mammals Omnivores Caddisfly and shredders) Mallard Birds Invertebrates Pocket Inverts Aquatic Carp Terrestrial Scrapers, grazers Mouse Vertebrates Vertebrates Herbivores submerged, emergent Vascular Plants and Algae grasses, Producers periphyton phytoplankton and floating trees macrophytes Biofilms Chemical NUTRIENTS (fungi, bacteria) Decomposers Carcasses, plant debris, fecal material, etc.
Data Quality Objectives for Inter-Areas Ecological Study Design • Multi-Increment Riparian Soil Sampling • Sediment Sampling • Abiotic media collection/analysis • Riparian soil, sediment, surface water, pore water • Biotic media collection/analysis • Plants, terrestrial macroinvertebrates, benthic macroinvertebrates, small mammals, kingbirds, clams, sculpin, amphibians
Field Measures • Exposure • Water, sediment, or riparian soil concentrations • Tissue concentrations • Effect • Adverse effect (no effect and lowest effect) levels in water or sediment and food • Tissue concentration-based effect levels • Field surveys • Ecosystem/Receptor characteristics • Habitat types • Physical characteristics (grain size, pH, OM)