Customer lifetime value (CLV)
Customer lifetime value (CLV). Outline. The concept of customer lifetime value (CLV) Comparison of CLV with related metrics Analyzing CLV Extensions of CLV analysis Drivers of CLV Uses of CLV metrics. Customer lifetime value (CLV).

Customer lifetime value (CLV)
E N D
Presentation Transcript
Outline • The concept of customer lifetime value (CLV) • Comparison of CLV with related metrics • Analyzing CLV • Extensions of CLV analysis • Drivers of CLV • Uses of CLV metrics
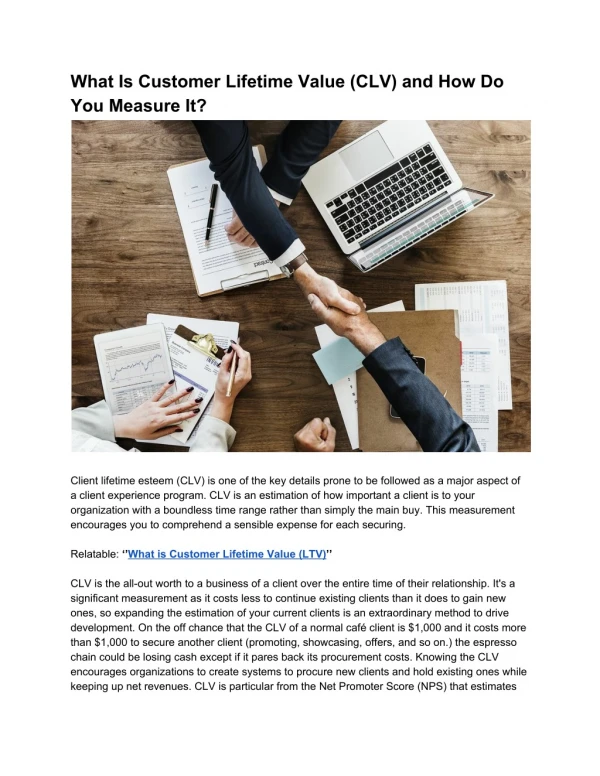
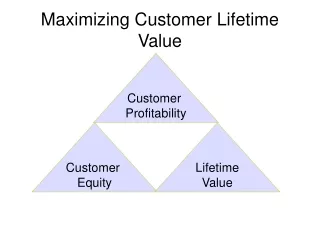
Customer lifetime value (CLV) the discounted cumulative cash flows that a customer brings to the firm over the entire duration of the relationship with the company (Kumar 2006); takes into account both revenues and costs and emphasizes relationships, not transactions; allows firms to assess the true worth of customers and to target their marketing efforts to the most profitable customers;
Comparison of CLV with other metrics • RFM method: • Recency: time since last purchase • Frequency: number of purchases within a given time period; • Monetary value: average purchase amount per transaction; • How RFM is used: • Assign weights to R, F, and M and then calculate the value of each customer; rank customers by value; • Only available for historical customer data; • Sensitive to the specification of the weights used;
Example RFM analysis R points: =IF(C2<=2,20,IF(C2<=4,10,IF(C2<=6,5,IF(C2<=9,3,IF(C2<=12,1,0))))) F points: =G2*3 M points: =IF(K2<=250,0.1*K2,25)
Comparison of CLV with other metrics (cont’d) • Share-of-wallet (SOW): • at the aggregate level, it is the proportion of category value accounted for by a brand or firm within a certain base of buyers; • at the individual level, it is the proportion of category value accounted for by a brand or firm within all category purchases of the buyer; • Example: Lisa spends $500 per month on groceries and she spends $300 at Wegman’s. Wegman’s SOW is what? • Problem that good data on purchases of other brands or at other stores are often hard to come by.
Comparison of CLV with other metrics (cont’d) • Past customer value (PCV): total contribution toward present profits based on all past transactions • GCit= gross contribution of the ith customer’s transaction at time t • T = number of time periods prior to the current time • d = discount rate (e.g., 15% per year, 1.25% per month)
Example of PCV Bill has made regular purchases at Best Buy between January and May. Assuming a gross margin of 30% and a monthly discount rate of 1.25%, what is Bill’s PCV at the end of May? PCV is calculated for all customers and PCV scores are used to prioritize customers.
How does CLV differ from traditional metrics? RFM, SOW and PCV are backward looking and do not take into account future revenues and future costs of servicing customers (depending on how long customers will be active) ; CLV takes into account the probability that a customer will be active in the future and thus future revenues as well as the costs of marketing to customers in order to retain them;
Analyzing CLV Assume that we have estimates of the average contribution margin per customer per period (M); then the average CLV of a customer is: • r = constant rate of retention of customers per period • d = constant discount rate • t = time period • T = total number of time periods considered This assumes there is no discounting in the first period and all customers contribute in the first period.
Example CLV calculation Margin per period: 120 Retention rate: 30% Discount rate: 10% Number of periods: 8
Analyzing CLV (cont’d) • With certain simplifying assumptions, we can get a general solution for CLV: • Constant contribution margin, discount rate and retention rate • Infinite time horizon • Example: Margin per period = 120, d = .1, r = .3 165
When does the customer pay? If customers pay at the beginning of the period, the contribution margin for the first period does not have to be discounted. [assuming there is no churn during the first period]
When does the customer leave? vs. [assuming there is no discounting during the first period]
Example: Comparing the four formulas Margin per period: 120 Retention rate: 30% Discount rate: 10%
In-class exercise Andrew is a regular customer at Otto’s brew pub in SC. He usually goes there once a week and has 2 pints (assume a price per pint of $5 and a gross margin for Otto’s of 80%). Assume that Andrew will be in SC for five years (use 4 weeks per month and 48 weeks per year). Using month as the discount period and a monthly discount factor of 1%, what is Andrew’s CLV to Otto’s? Repeat the calculations under various scenarios that Andrew may not remain a loyal Otto’s customer. Specifically, assume monthly retention rates of .99, .95, and .90. What’s the likelihood that Andrew will still be a customer after one year under these scenarios? How does CLV change?
Extending CLV analysis • Gross contribution margins GM (revenues minus variable costs) and marketing or customer retention costs RC (contact costs to retain customers, costs of loyalty programs, etc.) can be considered separately; • Margins and costs need not be constant over time; • Customer acquisition costs (AC) can be considered: • Only applies to new customers • Free trial period, sign-up incentives, etc. • Acquiring customers can be expensive
Extending CLV analysis (cont’d) Different customer segments may be considered which have different contribution margins, marketing costs, and retention rates This requires the specification of a switching matrix which specifies the probability that a customer from one segment will switch to a different segment in the next period (including a lost-for-good customer segment, from which there is no return)
CLV analysis for three segments: Office Star data (cont’d) GM = GM per segment * # of customers per segment at N+1 (summed across all segments) Marketing costs = Marketing costs per customer per segment * # of customers per segment at N (summed across all segments)
Drivers of CLV If CLV is calculated for individual customers, the drivers of CLV can be investigated; Previous research has identified various determinants of CLV: Reinartz and Kumar (2003)
Benefits of using CLV metrics • the most profitable customers can be selected for special retention efforts (not necessarily those generating the most revenue, those who have been with the company the longest, etc.) • customers can be grouped into segments based on their CLV and the segments can then be profiled using various drivers of CLV • Cross-classify CLV with relationship duration • Cross-classify CLV (future profitability) with PCV (historical profits) • resource allocation can be optimized based on the responsiveness of customers to marketing contacts • new prospects can be targeted based on profiles that are similar to existing high CLV customers
Segmentation by CLV and relationship duration Low relationship duration High relationship duration High CLV Low CLV (Kumar 2006)
Segmentation by past and future profitability Low PCV High PCV High CLV Low CLV (Kumar 2006)
Review: CLV A cell phone provider has acquired 10,000 new customers who have decided to sign up for unlimited cell phone service for at least one year for a monthly fee of $80. The variable costs of providing the service are $10 per customer. Payment is due at the end of each month. What’s the net present value of the profits from this customer base for the first year? Assume a yearly discount rate of 12 percent. What would we need to know to calculate the net present value of the profits over five years?
Review: CLV A catalogue marketer groups its customers into two segments: premier and regular. There are 1000 customers of each type. The contribution margins of the two segments are $100 and $50, respectively. The retention rates of premier and regular customers are 60% and 50%, respectively. Each period 30% of premier customers become regular customers and 10% are lost forever. Also, 10% of regular customers become premier customers and 40% are lost forever.
Computing the ROI of marketing investments Assume that without a certain marketing investment gross profit is $100,00, whereas with the investment it is $200,000 (where the investment of $50,000 has not been considered in the gross profit calculation): Assume that without a certain marketing investment gross profit is $100,00, whereas with the investment it is $150,000 (where the investment of $50,000 has already been subtracted from the initial gross profit):