Public Debt & Deficits: Economic Analysis & Solutions
740 likes | 771 Vues
Learn about the impact of public debt and deficits on the economy, GDP trends, debt strength, demographics, employment, and effective monetary strategies. Explore the significance of deficit vs. revenue and discover potential long-term solutions.

Public Debt & Deficits: Economic Analysis & Solutions
E N D
Presentation Transcript
Public Debt & Deficits Myles Wattsand Doug YoungDepartment of Agricultural Economics and Economics Montana State University February 2012
Links to the General Economy Gross Domestic Product (GDP) Debt Strength of the Dollar Aged Dependency Ratio Housing Employment 2
Economy Sizes International Monetary Fund, World Economic Outlook Database, September 2011 United Nations, Department of Economic and Social Affairs, Population Division (2011)
World GDP: Historical Trend World Bank national accounts data
U.S. and Eurozone GDP: Historical Trend World Bank national accounts data
Strength of U.S. Dollar: GDP of Eurozone Countries International Monetary Fund, World Economic Outlook Database, September 2011
Debt as a Percent of GDP (2010) International Monetary Fund, World Economic Outlook Database, September 2011
Aged Dependency Ratio United Nations, Department of Economic and Social Affairs, Population Division (2011). World Population Prospects
U.S. Debt • ($15 Trillion) Debt Down Grade
U.S. House Mortgages S&P/Experian Consumer Credit Default Indices
Case-Shiller 10 City House Price Index BLS CPI Index & S&P Case-Shiller
Employment (2010) Bureau of Labor Statistics/CPS “Education Pays”
Education Earnings Ratio(College Diploma/High School Diploma) Bureau of Labor Statistics, Current Population Survey
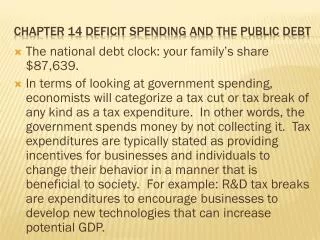
Deficits and Debts The Deficit and Debt Definition The Federal Debt in Perspective How Much is “Too Much?” The Long Term Outlook What Can be Done 15
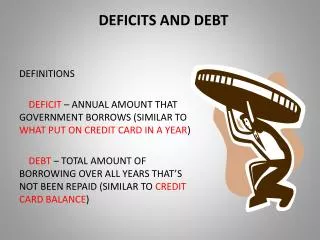
1. Definitions Deficit = Expenditure – Revenue Usually, per year “The Federal Government’s deficit in 2011 was $1.3 trillion.” Debt = Accumulation over time of deficits less surpluses At a point in time “The Federal Government’s Debt on January 13, 2012 was $15.2 trillion.” 16
Federal Revenues and Outlays(As a % of GDP) Historical Budget Data, as presented in Congressional Budget Office, The Budget and Economic Outlook: Fiscal Years 2011 to 2021 (January 2011). 17
2. The Debt – How Big is It?(As of January, 13 2012) Federal Debt $15.2 Trillion Held by the public $10.5 Trillion Held by governmental holdings $4.7 Trillion Non-Financial Corporate Business (As of December 8, 2011) Debt = $13.5 Trillion Assets = $29.3 Trillion Household + Nonprofit Sector (As of December 8, 2011) Debt = $13.8 Trillion Assets = $71.1 Trillion 18
Federal Debt (As a % of GDP) 20 Whitehouse Historical Budget Data
3. How Much Debt is “Too Much?” When lenders worry that the country won’t be willing and/or able to pay it back, so Interest rates rise to compensate lenders for: Default Risk and/or Inflation Risk 21
When Lenders Loose Faith…. Bond yields from: www.tradingeconomics.com
As of December 8, 2011 … The US Government Debt is NOT “Too Much” in the sense that it Threatens the Economic and Financial System But Neither Debt nor Deficits, as Conventionally Measured, Include “Promises” Made to Future Generations 24
4. The Long Term OutlookFederal Debt Held by the Public Under CBO’s Long Term Budget Scenarios (As a % of GDP) Projected Actual 25 CBO 2011 Long Term Budget Projections
Flat Revenues; Growing SpendingAlternative Fiscal Scenario (As a % of GDP) Projected Actual 26 CBO 2011 Long Term Budget Projections
5. What Can be Done? Cut Spending (from what it would otherwise be) Health Care Social Security Other (Discretionary) Spending Raise Revenues Tax Reform 27
Healthcare Expenditure (As a % of GDP) 28 OECD.StatExtracts
Health Care • Reduce Fraud • Legal (Malpractice) Reform • Require minimum deductibles and cost-sharing in Medicare supplements • Accountable Care Organizations • Salary (v. Fee for Service) • Coordinated (v. Fragmented) Care 29
Social Security Tax Revenues and Outlays, with Scheduled and Payable Benefits (As a % of GDP) 30 CBO 2011 Long Term Projections for Social Security
Social Security “Freeze” benefits (adjusted for inflation) today. Gradually increase early and full retirement ages Increase taxable earnings to cover more earnings (86% today) Use the “chained” CPI for inflation Cover all new government workers 31
Tax Reform-1Lower tax rates and broaden the base • Reduce the top personal rate from 35% to 23-29% • Repeal the AMT and phase out of deductions and exemptions • Tax capital gains (indexed for inflation) and dividends as ordinary income 32
Tax Reform - 2 Eliminate itemized deductions 12% tax credit for mortgage interest on principal residence (capped) 12% tax credit on charitable donations > 2% of AGI 33
Tax Reform - 3 Cap exclusion of employer-provided health insurance Tax interest on new S&L bonds Cap exclusion for contributions to retirement accounts at $20,000 or 20% of income Eliminate 150 other tax expenditures 34
Summary The US government debt is not now at dangerous levels A continuation of current policies for many more years is not feasible Solutions do exist Reform is (Politically) Possible: 1986 Tax Reform, 1993 Budget Compromise, 1996 Welfare Reform 35
More Information Congressional Budget Office Long Term Budget Outlook http://www.cbo.gov National Commission on Fiscal Responsibility and Reform http://www.fiscalcommission.gov 36
Trends in Agriculture Finance Myles Watts Department of Agricultural Economics and Economics Montana State University February 2012
Keys to the Future of Agriculture Assets and Debt Productivity and Demand Government Programs Ethanol Farmer Mac Basel Requirements International Competitiveness 38
Total Farm Assets - USA Inflation Adjusted using 2011 CPI 39 BLS CPI Index & USDA Economic Research Service
Total Farm Debt - USA Inflation Adjusted using 2011 CPI 40 BLS CPI Index & USDA Economic Research Service
U.S. Real Agricultural Land Prices/Acre Inflation Adjusted using 2011 CPI 41 BLS CPI Index, USDA Economic Research Service & National Agricultural Statistics Service
Productivity: Wheat and Corn Yields (Per Acre) USDA National Agricultural Statistics Service 43
Government Programs • Sequestration is about 6% in all agriculture programs including SNAP • Current Discussion • Eradicate direct payments • Minor reduction in other commodity and resource programs • About 5% reduction in SNAP 45
Overview of Ethanol FromJames Brown, Master’s Thesis in Department of Agricultural Economics and Economics, Montana State University, October 2011. Note: Recent corn production is about 12.4 billion bushels 46
Farmer Mac Secondary Markets including Farmer Mac Most mortgages of substantial time length are resold in the secondary market. Many are resold through Government Sponsored Enterprises (GSE). 47
Fannie Mae Freddie Mac Ginnie Mae Sallie Mae (until 2004) Federal Farm Credit Banks Farmer Mac GSEs 48
Mortgages are originated by primary lenders such as your neighborhood bank. Loans are sold to a secondary entity, some of which are GSEs, and some are very large private corporations. Secondary entities may sell or retain these loans. How Secondary Markets Work 49
Loans are bundled into mortgage backed securities These securities may be sold in tranches to multiple buyers through the secondary markets. Tranche purchasers are repaid in a hierarchical manner with senior investor paid first. If these Loans are Sold 50