Download
1 / 15
150 likes | 290 Vues
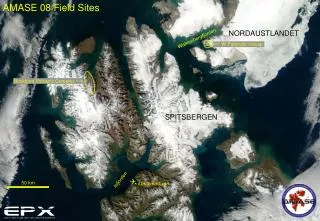
Storfjorden (Spitsbergen) Seismic Process and Its Time Patterns. A.V. Fedorov , V.E. Asming, S.V. Baranov Kola Branch of Geophysical Survey of RAS www.krsc.ru. Map of the region. SFZ. KBS. BRB. SPI. Knipovich ridge. 21.02.2008. Storfjord. Mohn ridge. Outline.

E N D
Storfjorden (Spitsbergen) Seismic Process and Its Time Patterns A.V. Fedorov, V.E. Asming, S.V. Baranov Kola Branch of Geophysical Survey of RAS www.krsc.ru
Map of the region SFZ KBS BRB SPI Knipovich ridge 21.02.2008 Storfjord Mohn ridge
Outline • Results of automatic data processing • Time distribution of number of events • Spectral differences • Quasi-periodicity
Before 21.02.2008 event Map of seismicity before 2008 by the NORSAR RRB catalogue.
After 21.02.2008 event Map of seismicity after 2008 by the NORSAR RRB catalogue.
Data processing The new algorithm based on beamforming and joint polarization methods was proposed. For a couple of processed phases it makes estimation of hypothesis that the fist phase is P-wave and the second one is S-wave of the same event. The SPI array data was processed by the new algorithm since 01/01/2008 until 31/07/2012
Results ML > 2 ML > - 0.2 The most part of automatically detected events epicenters hit into the 50 km radius area with center close to the main shock epicenter. The frequency-magnitude plot have a linear slope from a magnitude -0.2
Spatial distribution of events KBS The map of strong events location shows that the sequence does not belong to any one mapped fault SPI BRB ByS.G. Bergh & P. Grogan - Norw.J.Geol. The difference in Ts-Tp for different events shows that distance between the epicenters could amount to 40 km
Spectral content The cluster analysis of spectra of Storfjorden events has shown that there are 4 classes of events. The clusterization is not related to magnitudes of events, distances to the station and time position in the sequence
Quasi-Periodicity • There are several periods of sequence activation • The periodicity is clearly visible in distribution of weak events (M<1) • The first activation of weak events delayed from the main shock for a more than 30 days.
We have examined if there is a dependence between the seismicity rate and the noise level variations. The seismic noise variations have a strong yearly periodicity with maxima in Decembers and minima in Junes. The variations of seismicity rate can’t be explained by variations of the noise level ML < 1
Conclusions • Strong earthquake of 21 Feb. 2008 started one of the longest and intensive seismic sequence in the region • All events of the sequence can be divided into several different classes by spectral content • The event number time distribution of the sequence has a quasi-periodic behavior • Such quasi-periodicity may be related to high fluidization of the area
Hypothesis • We suppose that Storfjord seismic sequence is a combination of two seismic processes caused by strongest earthquake of 21.02.2008. • The first one is traditional aftershock sequence which gradually decreases with time. • The second one is a series of basically low magnitude events probably caused by high fluidization of seismic area. • Fluid accumulation in the area of strong earthquakes hypocenters lead to weakening of structural blocks connections that could cause swarms of low magnitude earthquakes. • Seismic rate periodicity could be connected with a periodicity of fluid accumulation • The hypothesis needs verification by a statistical modeling
Near real-time Storfjord monitoring http://www.krsc.ru/storfjorden (since 12.01.2011)