Download
1 / 1
10 likes | 119 Vues
Development of a diagnostic question cluster and post-assessment of college student understanding about population dynamics. Miranda A. Kearney and Nancy E. Stamp Biological Sciences, Binghamton University - State University of New York, Binghamton, NY. Post-assessment. Pre-assessment.

E N D
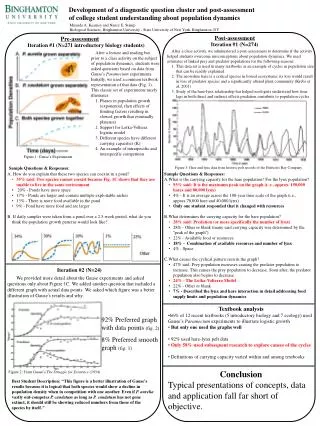
Development of a diagnostic question cluster and post-assessment of college student understanding about population dynamics Miranda A. Kearney and Nancy E. Stamp Biological Sciences, Binghamton University - State University of New York, Binghamton, NY Post-assessment Pre-assessment Iteration #1 (N=274) Iteration #1 (N=271 introductory biology students) • After a class activity, we administered a post-assessment to determine if the activity helped students overcome misconceptions about population dynamics. We used estimates of linked prey and predator populations for the following reasons: • This data set is used in many textbooks as an example of cycles in population size that can be readily explained • The snowshoe hare is a critical species in boreal ecosystems; its loss would result in loss of predator species and a significantly altered plant community (Krebs et al. 2001) • Study of the hare-lynx relationship has helped ecologists understand how time lags in both direct and indirect effects predation contribute to population cycles • After a lecture and reading but prior to a class activity on the subject of population dynamics, students were asked questions based on data from Gause’s Paramecium experiments. Initially, we used a common textbook representation of that data (Fig. 1). This classic set of experiments nicely illustrates: • Phases in population growth (exponential, then effects of limiting factors resulting in slowed growth that eventually plateaus) • Support for Lotka-Volterra logistic model • Different species have different carrying capacities (K) • An example of intraspecific and interspecific competition Figure 1: Gause’s Experiments Sample Questions & Responses: Figure 3: Hare and lynx data from historic pelt records of the Hudson’s Bay Company • How do you explain that these two species can coexist in a pond? • 35% said: Two species cannot coexist because Fig. 1C shows that they are unable to live in the same environment • 20% - Ponds have more space • 17% - Ponds are larger and contain multiple exploitable niches • 13% - There is more food available in the pond • 9% - Pond have more food and are larger • If daily samples were taken from a pond over a 2.5-week period, what do you think the population growth patterns would look like? • Sample Questions & Responses: • What is the carrying capacity for the hare population? For the lynx population? • 93% said: It is the maximum peak on the graph (i. e., approx. 150,000 hares and 80,000 lynx) • 4% - It is an average across the 100-year time scale of the graph (i.e., approx.70,000 hare and 40,000 lynx) • Only one student responded that it changed with resources • What determines the carrying capacity for the hare population? • 28% said: Predation (or more specifically the number of lynx) • 28% - Other or blank (many said carrying capacity was determined by the “peak of the graph”) • 22% - Available food or resources • 18% - Combination of available resources and number of lynx • 4% - Space • What causes the cyclical pattern seen in the graph? • 47% said: Prey population increases causing the predator population to increase. This causes the prey population to decrease. Soon after, the predator population also begins to decrease. • 24% - The Lotka-Volterra Model • 22% - Other or blank • 7% - Described the lynx and hare interaction in detail addressing food supply limits and population dynamics Iteration #2 (N=24) We provided more detail about the Gause experiments and asked questions only about Figure 1C. We added another question that included a different graph with actual data points. We asked which figure was a better illustration of Gause’s results and why. • Textbook analysis • 66% of 12 recent textbooks (5 introductory biology and 7 ecology) used Gause’s Paramecium experiments to illustrate logistic growth • But only one used the graphs well • 92% used hare-lynx pelt data • Only 58% used subsequent research to explore causes of the cycles • Definitions of carrying capacity varied within and among textbooks 92% Preferred graph with data points (fig. 2) 8% Preferred smooth graph (fig. 1) Conclusion Typical presentations of concepts, data and application fall far short of objective. Figure 2: From Gause’s The Struggle for Existence (1934) Best Student Description: “This figure is a better illustration of Gause’s results because it is logical that both species would show a decline in population density when in competition with one another. Even if P. aurelia vastly out-competes P. caudatum as long as P. caudatum has not gone extinct,itshould still be showing reduced numbers from those of the species by itself.”