Download
1 / 22
220 likes | 423 Vues
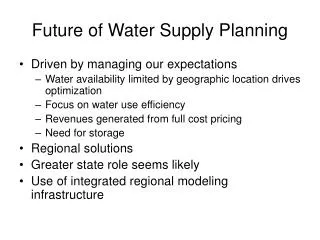
Economic Value of Regional Water Supply Planning. Presented by Margaret Schneemann Water Resource Economist Illinois-Indiana Sea Grant University of Illinois Extension Chicago Metropolitan Agency for Planning. Benefits to Utilities Deferral and/or downsizing of capital facilities

E N D
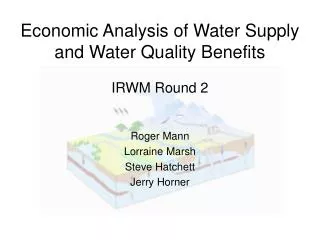
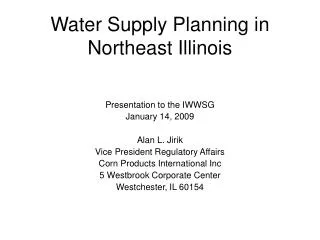
Economic Value of Regional Water Supply Planning Presented by Margaret Schneemann Water Resource Economist Illinois-Indiana Sea Grant University of Illinois Extension Chicago Metropolitan Agency for Planning
Benefits to Utilities Deferral and/or downsizing of capital facilities Reduced operation & maintenance expenses Reduced water purchases Enhanced reputation and customer relations Avoided wastewater treatment costs Reduced energy costs Benefits of Regional Water Supply Planning
Benefits of Regional Water Supply Planning Benefits to Society • Increased flow of environmental and ecosystem services • Avoided shortages • Avoided regional economic losses • Avoided costs of short-term shortage/drought management programs • More stable utility revenue and avoided lost profits • Avoided reduced consumer consumption of water
Costs of Regional Water Supply Planning • Planning Costs • State level • Regional planning • Utility level • Plan Implementation • Cost of recommended strategies
Case Studies • Metropolitan North Georgia Water Planning District (MNGWPD) • Massachusetts Water Resources Authority (MWRA) • Seattle Public Utilities (SPU) • City of Phoenix Water Services Department • Texas Region H Houston-Galveston Metropolitan Area
Economic Analysis of Regional Water Supply Planning • Review water supply plans for each region. • Contact regional planners to clarify and fill in data gaps. • Monetary values reported in year 2005 dollars, water units in millions of gallons per day (mgd) for consistency. • Benchmark range of values provided: • Total savings per mgd - incremental net benefits over the planning horizon. • Benefit-cost ratio – present value of benefits divided by the present value of costs. • Annual net benefit per household - annual net benefits per household.
Metropolitan North Georgia Regional Description • 2000 • Population 4 million • Water demand 650 mgd • Water supply 933 mgd • 2030 • Population 8 million • Water demand 1,081-1,300 mgd • Water supply 1,267 mgd Source: http://www.northgeorgiawater.com/images/DistrictMap_Web.jpg
Metropolitan North Georgia Water Planning District • Demand could exceed supply by 2030. • Recommend: • Supply development • Water conservation • Water sharing • Water reclamation Source: Metropolitan North Georgia Water Planning District Water Supply and Water Conservation Management Plan 2003
Massachusetts Water Resources Authority Regional Description • 2000 • Population 2.5 million • Water demand 214 mgd • Water supply 300 mgd • 1987 • Population 2.2 million • Water demand 336 mgd Source: http://www.mwra.state.ma.us/04water/html/watermapsimple903.jpg
Massachusetts Water Resources AuthorityBoston Region • Conservation efforts and infrastructure improvements deferred river diversion plans. • Projected 2020 water demand below 300 mgd. • Decrease in demand to below system safe yield. Source: Das, Joshua, MWRA “Supply and Demand Management of Greater Boston’s Water System (1600s –the present)” 2007
Massachusetts Water Resources Authority Value of Regional Water Supply Planning
Seattle Public UtilitiesRegional Description • Water supply 171 mgd • 1990 • Population 1.1 million • Water Demand 168 mgd • 2000 • Population 1.2 million • Water Demand 148 mgd • 2010 • Population 1.3 million • Water Demand 134 mgd • 2030 • Population 1.6 million • Water Demand 129 mgd Source: Seattle Public Utilities Water System Plan Public Review Draft 2006
Seattle Public UtilitiesWater System Plan Conservation efforts have extended the water supply for 50 years. No new supply sources needed until after 2060. • 1990s: water conservation programs decrease consumption 171 to 150 mgd. • 2007: conservation commitment for 2011-2030 with 15 mgdsavings. Source: Dietemann, Al. Seattle Public Utilities 2008.
Seattle Public Utilities Value of Regional Water Supply Planning
Phoenix Water Services Department Regional Description • 2005 • Population 1.4 million • Water Demand 314 mgd • Water Supply 368 - 381 mgd • 2020 • Population 2 million • Water Demand 419 - 467 mgd • Water supply 279 - 436 mgd Source: City of Phoenix Water Resources Plan Update 2005
Phoenix Water Services DepartmentWater Resources Plan Phoenix has sufficient water supplies to meet expected demand in the majority of future scenarios. • Water conservation program • water pricing reform • indoor residential water conservation • industrial and commercial water conservation • plant and turf irrigation efficiency • water-efficient landscaping • Stacking of supply options by cost-effectiveness Source: City of Phoenix Water Resources Plan Update 2005
Phoenix Water Services DepartmentValue of Regional Water Supply Planning
Texas Region H - Houston Region Regional Description 2000 • Population 4.8 million • Water Demand 1,864 mgd • Water Supply 2,365 mgd 2060 • Population 10.9 million • Water Demand 3,046 mgd • Water Supply 2,288 mgd Source: 2006 Texas Region H Water Plan
Texas Region HHouston Region City of Houston conservation program cut demand 7.3% through 2006. Declines in groundwater supply will necessitate increased use of surface water. Demand rising through 2060. Source: 2006 Texas Region H Water Plan
Texas Region H Houston RegionValue of Regional Water Supply Planning