10.1 Different Ways of Presenting Information
450 likes | 1.63k Vues
10.1 Different Ways of Presenting Information. Different ways of presenting information Lists Tables Charts Graphical presentations. 10.1 Different Ways of Presenting Information. Lists Used to present information in point form to emphasize the key points of a message.

10.1 Different Ways of Presenting Information
E N D
Presentation Transcript
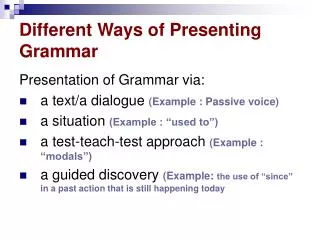
10.1 Different Ways of Presenting Information • Different ways of presenting information • Lists • Tables • Charts • Graphical presentations
10.1 Different Ways of Presenting Information • Lists • Used to present information in point form to emphasize the key points of a message. • Common types of lists • Ordered list • Unordered list • Nested list: a list that consists of other lists within itself
10.1 Different Ways of Presenting Information • Lists Examples of an ordered list, an unordered list and a nested list
10.1 Different Ways of Presenting Information • Tables • A structured way to present information in tabular form. • It is useful in the following situations: • Present a number of records at the same time. • Present information in a meaningful order, such as a chronological sequence. • Compare the characteristics of two or more items. • Data is put in columns with appropriate headers. • Sentences should be concise and short.
10.1 Different Ways of Presenting Information • Charts • A graphical presentation of numeric data • Widely used for presenting tabular data • Advantages: • Enhance the reader’s understanding by visualizing the data through a simple graphical format. • Facilitate data analysis and interpretation by summarizing the results.
10.1 Different Ways of Presenting Information • Charts Common types of charts
10.1 Different Ways of Presenting Information • Charts A bar chart
10.1 Different Ways of Presenting Information • Charts A pie chart
10.1 Different Ways of Presenting Information • Charts A line chart
10.1 Different Ways of Presenting Information • Graphical presentations • Help users understand information easily. • Information can be presented clearly through simple illustrations. • Advantages: • Arouse the interest of audience. • Illustrate abstract concepts through the image of concrete objects. • Present information in a more organized manner.
10.1 Different Ways of Presenting Information • Graphical presentations Present abstract concept through concrete objects graphically. Graphical presentations canpresent information precisely.
10.2 Using Multimedia Elements in aPresentation • Multimedia presentation • The use of a computer to integrate multimedia elements in a presentation. • Multimedia elements • Include text, graphics, animation, audio and video • Help us deliver information effectively and make the presentation more attractive.
10.2 Using Multimedia Elements in aPresentation • Multimedia elements General usages of various multimedia elements
10.3 Creating a Presentation • Organizing the relevant information • Introduction • Explain the main objective of your presentation at the beginning. • The body • Key points should be explained clearly one by one. • Keep the explanations of each key point simple and short. • Conclusion • Give a short conclusion to re-emphasize the key points and the important information of the presentation. • A brief ‘Question and Answer’ session should be included after the presentation is finished.
10.4 Using Microsoft PowerPoint to Construct aPresentation • Microsoft PowerPoint • A powerful tool to create different kinds of presentations: • Slide shows • Web-based presentations • Multimedia documents
10.4 Using Microsoft PowerPoint to Construct aPresentation • Working environment of Microsoft PowerPoint 2007 Quick Access Toolbar Group Command tab Office button Ribbon Thumbnail Dialog Box Launcher Slide pane Placeholders Slides / Outline pane Notes pane Theme Working environment of Microsoft PowerPoint 2007 Views buttons Zoom slider
10.4 Using Microsoft PowerPoint to Construct aPresentation • Working environment of Microsoft PowerPoint 2007 Descriptions of the elements in Microsoft PowerPoint 2007
10.4 Using Microsoft PowerPoint to Construct aPresentation • Working environment of Microsoft PowerPoint 2007 Descriptions of the elements in Microsoft PowerPoint 2007
10.4 Using Microsoft PowerPoint to Construct aPresentation • Working environment of Microsoft PowerPoint 2007 • It is a good habit to save your work frequently while you are editing a presentation file. Descriptions of the elements in Microsoft PowerPoint 2007
10.4 Using Microsoft PowerPoint to Construct aPresentation • Adding slides and changing themes • Adding slides • When you create a presentation file in PowerPoint 2007, a new slide is automatically added to the ‘Slide’ pane: • The layout of the slide is ‘Title Slide’. • The theme is ‘Office Theme’. • To add a new slide other than the default one: • Click the lower part of the ‘New Slide’ button in the ‘Slides’ group on the ‘Home’ tab. • The ‘New Slide’ gallery is displayed. • Select a layout you want.
10.4 Using Microsoft PowerPoint to Construct aPresentation • Adding slides and changing themes • Adding slides Choose a slide layout in the ‘New Slide’ gallery.
10.4 Using Microsoft PowerPoint to Construct aPresentation • Adding slides and changing themes • Changing themes • Change the theme by clicking the ‘Design’ tab of the Ribbon. • In the ‘Themes’ group, move the cursor on top of any theme to preview it. • After you click the theme, the theme is applied to the whole presentation. Change the theme for a presentation.
10.4 Using Microsoft PowerPoint to Construct aPresentation • Adding slides and changing themes • Changing themes • The ‘More’ button is situated at the right bottom corner of the list of themes. • Click the ‘More’ button, a gallery showing other built-in themes is displayed. ‘More’ button Click the ‘More’ button to display the ‘All Themes’ gallery.
10.4 Using Microsoft PowerPoint to Construct aPresentation • Adding text and inserting images into slides • Adding text by inserting a new textbox Method 1: Enter text into the placeholder. Method 2: Click ‘Insert’ →‘Text Box’ to insert a newtextbox. Two different ways to enter text into a slide
10.4 Using Microsoft PowerPoint to Construct aPresentation • Adding text and inserting images into slides • Adding text by inserting a new textbox • To insert a new textbox: • Click the ‘Text Box’ button on the ‘Insert’ tab. • Click the slide where you want the text to be inserted. • A text box will be displayed for text entry. • To format the text: • The ‘Font’ group contains command buttons for changing the font type, font size as well as the font style. • The ‘Paragraph’ group contains command buttons for the text alignment in a textbox such as left, centre, right or justify. • The ‘Column’ button in the ‘Paragraph’ group enable users to format the text in a textbox into two or more columns.
10.4 Using Microsoft PowerPoint to Construct aPresentation • Adding text and inserting images into slides • Adding text by inserting a new textbox ‘Font’ group ‘Paragraph’ group Basic text formatting command buttons
10.4 Using Microsoft PowerPoint to Construct aPresentation • Adding text and inserting images into slides • Adding text by inserting a new textbox • Click the ‘Format’ tab of the Ribbon for more text formatting styles. • A lot of advanced styles such as ‘Shape’ styles or ‘WordArt’ styles are grouped in the ‘Format’ tab. Advanced formatting styles for text and shapes
10.4 Using Microsoft PowerPoint to Construct aPresentation • Adding text and inserting images into slides • Inserting images • To insert a picture from file: • Click the ‘Picture’ button on the ‘Insert’ tab • The ‘Insert Picture’ dialogue box is displayed. • Selecting the image file and the picture will be displayed in the centre of the slide. Inserting a picture from a file by clicking ‘Picture’ button
10.4 Using Microsoft PowerPoint to Construct aPresentation • Adding text and inserting images into slides • Inserting images • To format the picture: • Use the buttons in the ‘Format’ tab. Editing the picture by using ‘Format’ tab
10.4 Using Microsoft PowerPoint to Construct aPresentation • Inserting tables and charts into slides • Inserting tables • To insert a table into a slide: • Click the ‘Table’ button on the ‘Insert’ tab. • Move the cursor to a box to select the desired rows and columns. • Click a box in the ‘Table’ gallery to insert a table. • Alternatively: • Click the ‘Table’ button on the ‘Insert’ tab. • Click the ‘Insert tables’ option in the ‘Table’ gallery. • Enter the desired number of rows and number of columns for the table in the dialogue box displayed and then click ‘OK’.
10.4 Using Microsoft PowerPoint to Construct aPresentation • Inserting tables and charts into slides • Inserting tables Insert a table by clicking a box in the ‘Table’ gallery. Insert a table by clicking the ‘Insert Table’ option.
10.4 Using Microsoft PowerPoint to Construct aPresentation • Inserting tables and charts into slides • Inserting charts • To insert a chart into a slide: • Create a chart in Microsoft Excel 2007. • Copy and paste the chart onto the slide. • Alternatively, you can click the ‘Chart’ button in the ‘Illustrations’ group on the ‘Insert’ tab. Insert a chart by clicking the ‘Chart’ button.
10.4 Using Microsoft PowerPoint to Construct aPresentation • Adding slide transition effects • Slide transition • The way one slide changes to the next slide in a slide show • Can be defined using ‘Preview’ group, ‘Animations’ group and ‘Transition to This Slide’ group on the ‘Animation’ tab • The ‘Transition to This Slide’ group shows a list of slide transitions that can be applied to the current slide. • Other changes that can be made for a slide transition between two slides: • Setting the speed of a transition • Applying a transition sound effect • Specifying the event to activate the slide transition
10.4 Using Microsoft PowerPoint to Construct aPresentation • Adding slide transition effects Apply a transition sound effect. Apply a slidetransitionto all slides. Specify the event to start a slidetransition. Change the speed ofthe slidetransition. Define a slide transition.