Download
1 / 42
420 likes | 438 Vues
Improving quality through the Scottish Renal Registry. UK Renal Registry 2015 Annual Audit Meeting. Dr Jamie Traynor Technical Director, Scottish Renal Registry Dr Peter Thomson Consultant Nephrologist, Glasgow Renal & Transplant Unit, NHS Greater Glasgow and Clyde.

E N D
Improving quality through the Scottish Renal Registry UK Renal Registry2015 Annual Audit Meeting Dr Jamie TraynorTechnical Director, Scottish Renal Registry Dr Peter Thomson Consultant Nephrologist, Glasgow Renal & Transplant Unit, NHS Greater Glasgow and Clyde
Improving quality through the Scottish Renal Registry Renal units and Satellite dialysis units in Scotland 31 December 2013 Jamie Traynor Technical Director Scottish Renal Registry
Scottish Renal Registry (SRR) Registry of all patients receiving renal replacement therapy (RRT) for established renal failure in Scotland • Established 1991 • Data backfilled to 1960 from ERA-EDTA Registry • 100% unit and patient coverage • High level of clinical support and involvement • Aim is paperless data collection • The data are taken from that routinely collected for patient care, electronically collated and reused by the SRR
SRR aims and objectives www.srr.scot.nhs.uk SRR AIM To improve the care of patients with established renal failure (ERF) treated with renal replacement therapy (RRT) by systematic and comprehensive analysis, including audits, of service provision, clinical management and outcomes. OBJECTIVES To promote equity of access to and of quality of care for renal patients across Scotland. Support staff to use the data effectively to drive improvement, to support staff education and training and to support future service provision and developments. Collaborate with other agencies to develop quality improvement initiatives and to ensure best use of data.
SRR Functions • Quality improvement • Clinical governanceIndividual clinicians Renal unitsNationally commissioned renal transplantation and simultaneous kidney pancreas transplantation • Service planning“The data from the SRR was invaluable and supported the group in their decision-making process.” Chris Myers Senior Commissioning Programme Manager • Research • Teaching and training
SRR work stream is directed and governed by the Steering Group.Core work – Standards of Care, Epidemiology, Survival analysesSRR Annual Report • Collaborations • Diabetes SCI-DC • Health Protection Scotland (HPS) • Access to transplant and transplant outcome measures (ATTOM) • UK Renal Registry (UKRR) / UK Renal Data Collaborative(UKRDC) • ERA-EDTA/ USRDS • Scottish Cancer Registry • NHS QIS • Renal Patient ViewMedicines reconciliation projectPROMS PREMS • SMARRT Steering Group • SRR National Vascular Access Appraisal Project • Scottish Renal Biopsy Registry Steering Group
Approaches to quality improvement • Regular audit and feedback • Focus meetings of Scottish Renal Association targeting areas of clinical variationPresentations from best performing units, improving units, struggling units • Patient involvement – PREMs • Focused projects • Sharing of learning • Data linkage
Percentage of hospital haemodialysis patients achieving urea reduction ratio ≥ 65% in 1994 and 1998 Scottish Renal Registry Report 1998
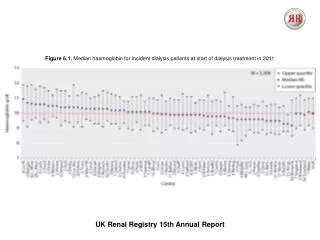
Percentage of adult haemodialysis patients with haemoglobin concentration ≥ 10g/dL 1995-2010
In addition to basic audit data • Patient travel times • Staffing and facilities audit • Time to transplant listing • Adjustment for social deprivation
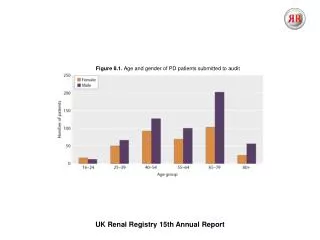
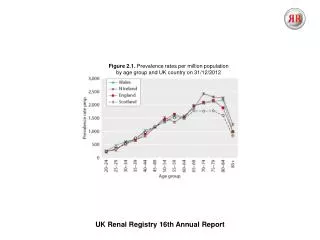
Age specific incident RRT population 1994 to 2013 per 100000 population SRR Report 2013
SMARRT – Scottish Mortality Audit RRT • Between 01 January 2008 and 31 December 2012 there were 2172 deaths among RRT recipients. • 8 – 11% of the prevalent RRT population per year. • Cause of death data are available for 2136 (98%) Location of death for 2099 (96.5%)Circumstances leading to death for 2149 (98.9%)
Percentage of deaths 2008-2012 in each category of concern by renal unit SRR Report 2012
Frequency of areas of concern in management which may have, or did contribute to death 2008-2012 SRR Report 2012
SMARRT • All renal units now hold regular Morbidity and Mortality (M+M) meetings. • Group allocation of level of concern score at M+M meetings. • Stimulated in depth analysis of certain categories of deaths of RRT patients. • Development of facility to share the learning from, and resources developed, as a result of category 4 and 5 deaths.
National Vascular Access Appraisal Project Dr. Peter Thomson Consultant Nephrologist Glasgow Renal & Transplant Unit
% Incident Patients with AV Access SRR report 2014
% Incident Patients with AV Access SRR report 2014
% Prevalent Patients with AV Access SRR report 2014
% Prevalent Patients with AV Access SRR report 2014
SAB event rate / 1000 HD-exposed days (2006 to June 2010) Unpublished data – courtesy of SRR /HPS
SAB event rate / 1000 HD-exposed days (2006 to June 2010) Unpublished data – courtesy of SRR /HPS
There is clear variation in outcomes… What are the characteristics of VA pathways that associated with successful outcomes? What are the characteristics of VA pathways that are associated with less successful outcomes?
There is clear variation in outcomes… …which suggests there is variation in the underlying processes. What are the characteristics of VA pathways that associated with successful outcomes? What are the characteristics of VA pathways that are associated with less successful outcomes?
What do the underlying processes for VA delivery look like in the different units?
What are the characteristics of VA services that associated with greatest ‘success’? What are the characteristics of VA services that are associated with least ‘success’?
Hypotheses? • Successful vascular access delivery is not all about good procedures, but good processes. • That there is no single ‘universal’ process that is suitable for all renal services. • The appraisal can provide bench-marking and process data that will facilitate improvement work/service delivery.
Methods • Visit all 10 Scottish Units. • Meet the key-personnel involved in vascular access work. • Get quantitive/numerical data on relevant variables. • Get qualititative data on relevant themes.
Methods • 4 Domains of interest: • Populations • Processes • Practice • Thematic Analyses
Descriptive Data • Population:- Number of RRT patients Number of HD patients Single v multicentre dialysis facilities % incident HD patients with AV access % prevalent HD patients with AV access SAB rate /1000 HD-exposed days
Descriptive Data • Process:- Numbers and type of personnel involved MDT Diagrammatic representation of AVF pathways Perceived strengths/weaknesses Funding/corporate structure 6/52 data capture on vascular access activity
Descriptive Data • Practice Sonosite surveillance (inc/prev, proactive/reactive) Transonic surveillance De-clotting practice Out of hours arrangements MRSA eradication TCVC locking TCVC dressings Button hole cannulation
Thematic Analyses • Interviews: • Semi-structured • Modelled on validated constructs from industry • Recorded and Transcribed • Coded for relevant themes • nVivo analysis • Patients / Nurses / Nephrologists / Surgeons / Radiologists
Thematic Analyses • Aim to identify: • Characteristics of successful services. • What matters most to which groups. • What the definition of ‘quality’ in vascular access is.
Where are we now? • All units visits (1668 miles driven) All data gathered (120 separate variables) 85% interviews transcribed and coded Write up by May this year Abstracted version in SRR report Full version on website & some printed hard copies A lot of presentations…
10 things we have learned so far • Every unit has it’s vulnerabilities • Nobody knows their own outcomes • There is more than one way to skin a cat • Process v Procedure • Networks v Silos • Define the MDT • Protect the MDT • Wants v needs (education, cultural/environmental influences) • Need to refine /re-define markers of quality (personal access solution) • Considerable will to improve (keeness for national QI strategy)
The Future? • Scottish Vascular Access Clinical Network • Clinical Governance • QI • Research • Education • Training / Accreditation • Patient Experience
Darlinda’s Charity for Renal Research Acknowledgements Scottish Renal Registry
Acknowledgements Scott Oliver David Kingsmore Ram Kasthuri Ann Humphrey Stuart Suttie Jackie McDonald Glasgow Renal Research Group