Download
1 / 1
110 likes | 708 Vues
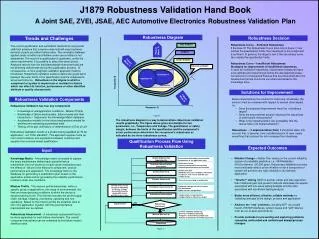
VERY ROBUST. Failure Mode A. ROBUST. Failure Mode C. LEAST ROBUST. Robustness Margin. Parameter B. Application II. Application II . Qualification setup. Potential risk and failure mechanism. Monitor plan set up. Reliability Characterization. Perform stress tests. Specification.

E N D
VERY ROBUST Failure Mode A ROBUST Failure Mode C LEAST ROBUST Robustness Margin Parameter B Application II Application II Qualification setup Potential risk and failure mechanism Monitor plan set up Reliability Characterization Perform stress tests Specification Failure Mode B Parameter A J1879 Robustness Validation Hand BookA Joint SAE, ZVEI, JSAE, AEC Automotive ElectronicsRobustness ValidationPlan Robustness Diagram Trends and Challenges Robustness Decision Robustness Curve - Sufficient Robustness If the Area Of The Robustness Curve (blue ring in figure 1) lies outside the specification limits, the robustness of the component is sufficient. In general, the target is met if the robustness curve lies outside the specification limits. Robustness Curve – Insufficient Robustness Strategies for improvement of insufficient robustness. In case of insufficient robustness, improvement measures have to be defined and implemented during the development phase. Corrections for Unexpected Failures that are discovered after the development phase should be corrected and added to the knowledge base. The current qualification and verification methods do not provide statistical evidence that a device under test will meet customer demand of parts per million failure rates. The correlation between applied stress condition and lifetime under use condition is not established. The result of a qualification is qualitative, under the same requirements, it is possible to select the worst choice. Analyzed returns from the field demonstrate that some tests are not detecting deficiencies during the qualification process. In consequence, a more pragmatic validation approach must be introduced.Robustness validation seeks to define the guard band between the outer limits of the specification and the component's actual performance. Robustness is the degree to which a component or system is impervious or resistant to factors which can effect its function, performance or other identified attribute or quality characteristic. Solutions for Improvement Robustness Validation Components • Before implementing the solution for improving robustness, the solution must be reviewed with respect to several other aspect, i.e.: • Does the expected improvement meet the robustness target? • Does the improvement solution influence the robustness of other failure mechanisms? • What is the implementation risk (probability that the device fails in it’simplementation)? • Robustness ~ (1-Implementation Risk) It should be taken into account that, in general, from a statistical point of view, nearly everything that reduces the risk increases the robustness. • Robustness Validation has four key components • Knowledge of use/application conditions - Mission Profile • Knowledge of failure mechanisms, failure modes and their interactions – Captured in the Knowledge Matrix database • Acceleration models for the failure mechanisms needed for defining and assessing accelerated tests • Testing of the part until failure or determination of End of Life • Robustness Validation results in a product being qualified as “fit for application”, not “fit for standard”. This approach requires more up front communication and explanation between customer and supplier than a stress-based qualification. Figure 1. The robustness diagram is a way to demonstrate robustness validation results graphically. The figure above gives an example for two parameters, i.e., Temperature and Voltage. The guard band, or safety margin, between the limits of the specification and the component's actual performance determines the component’s robustness as indicated by the three robustness curves. Qualification Process Flow Using Robustness Validation Expected Outcomes Input • Mindset Change – Rather than relying on the current reliability system of probability prediction, i.e., 95%Reliability / 90%Confidence (50,000 ppm), Robustness Validation provides more and better data to prove whether or not a component of system will achieve very high reliability in its intended application. • “Smarter” testing which is quicker, better and less expensive than traditional past and present methods eliminates the wastes associated with low-value testing/analysis and the risks associated with insufficient testing/analysis. • Better more efficient, effective, reliable methods for validating changes to the design, process and application. • Address the “real” problems, including NTF (no trouble found), HW/SW interfaces, system issues and “soft” failures such as out-of-spec performance. • Provide methods for preventing and capturing problems caused by unintended and undisclosed design/process changes. Quality Engineering requirements Knowledge Matrix - A knowledge matrix is needed to capture the basic mechanisms behind each potential failure mechanism, the root cause(s) of each failure mechanism and the effects of failure to the electronic component, product performance and application. The knowledge matrix is the database for generating a qualification plan based on the application profile and for generating the reliability performance numbers under use conditions. Mission Profile - The mission profile determines, within a specific group of applications, the range of environmental, life time and manufacturing conditions to which the device is exposed during its life. This life time includes the whole supply chain (storage, shipping, processing, operating and non-operating). Based on the mission profile the potential risks to fail in the application together with the potential failure mechanisms can be defined. Robustness Assessment - A robustness assessment has to be done separately for each failure mechanism. The overall component robustness can be estimated by the failure mode’s statistical data. Environment defined by mission profile Performance in the application spec Failure mechanism Known potential failure mechanisms Unknown potential failure mechanisms Qualification plan Reliability tests, test conditions, duration & acceptance, test vehicle, Sample size / number of lots Stress tests according to quality plan Review stress set up Design for Reliability Screening strategy Technology solution Application review Mission profile review Parameter change over time of stress Fail distribution Model used for extrapolation Robustness Assessment Compare data to requirements Compare delta to robustness target Robustness Sufficient? NO Improvement YES Intrinsic reliability monitoring Extrinsic reliability monitoring Frequency of monitoring/sample size Actions on deviations in monitoring results Production Figure 2.