Extragalactic Astronomy & Cosmology Distance Ladder
560 likes | 885 Vues
[4246] Physics 316. Extragalactic Astronomy & Cosmology Distance Ladder. Jane Turner Joint Center for Astrophysics UMBC & NASA/GSFC 2003 Spring. Cosmic Distance Ladder. Back to the Cosmic Distance Ladder. 1) Measuring distances within the solar system- radar

Extragalactic Astronomy & Cosmology Distance Ladder
E N D
Presentation Transcript
[4246] Physics 316 Extragalactic Astronomy & CosmologyDistance Ladder Jane Turner Joint Center for Astrophysics UMBC & NASA/GSFC 2003 Spring
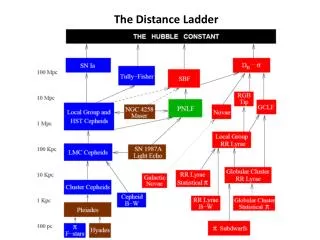
Back to the Cosmic Distance Ladder 1) Measuring distances within the solar system-radar 2) Use parallax to determine distance to nearby stars CALIBRATE NEXT RUNG: - Determine the intrinsic brightness of MS & Cepheid Variables 3) For other galaxies, assume brightness of MS distribution same as our galaxy, get distance of other galaxy 4) For more distant galaxies, assume know absolute brightness (luminosity) of Cepheids, get distance of host galaxy CALIBRATE NEXT RUNG:- Determine absolute brightness of Supernovae 5) Measure supernovaein very distant galaxies, get distance of host galaxy Get absolute brightness of distant galaxies from rotation rates (Tully-Fisher) -thus get distance from apparent brightness CALIBRATE NEXT RUNG:- Determine distances to distant galaxies, determine redhsift from spectra and derive relation between distance and redshift 6) Using relation established from lower rungs, measure spectra, redshiftsand derive distances from galaxies which are furthest away
The Tully-Fisher Relation The Tully-Fisher (TF) relation is an empirical relation between L luminosity & rotational velocity Vc for Spiral Galaxies (see H&H page 275) LVc4 Thus, measure Vc, & integrated flux of a galaxy F derive the distance r (L = 4 r2 F) Calibrated using the spirals in the Local Group (M33 & M31). Other nearby spirals reveals scatter in the relation
TF Calibrators M31 & M33 M31 (Andromeda) M33 (Triangulum)
TF Calibrators Three Others NGC2403 M81 (Bode’s Galaxy) NGC3351
TF Relation - Problems Potential Problems: Does not obviously include the effects of dark matter (which we will discuss later- thought to dominate the masses of galaxies) assumes circular symmetry assumes all galaxies have the same mass/luminosity ratio assumes all galaxies have the same surface brightness But it seems to work ! Measure velocity and thus determine luminosity - another distance estimator, accurate and useful out to 100 to 200 Mpc
Distance from TF for 5 clusters Recession Velocity (via other means) [Image Credit:Shoko Sakai, UCLA]] Distance from TF
Distance from TF for 5 clusters Recession Velocity (via other means) [Image Credit:Shoko Sakai, UCLA]] H0 = 73 km s-1 Mpc -1 !! Distance from TF v= H0d
Several Thousand Galaxies H0 = 55 km s-1 Mpc -1 !! Distance from TF [Image Credit: KLUN Group]] (H0 = 72 km s-1 Mpc -1) Recession Velocity (via other means) But most estimates: H0 = 81+/-11 km s-1 Mpc -1 (Jacoby 1992)
Supernovae -also rung 5 We know how supernovae occur…
Classification Schemes Supernovae are classified into several types, based (primarily) on shape of light curve & elements observed in spectrum Type II (eg SN1054, SN1987A) - H + heavies in the spectrum - collapse of degenerate Fe core in massive stars i.e. > 8 or 9 M - Rate is one every 44 yr in our Galaxy Subdivided into two classes based on shape of light curve Type II-L - Light decline relatively smoothly Type II-P - Light curves exhibit a "plateau" 1 to 3 months after peak [Possible distance indicator but out of favor as luminosities have some range]
Classification Schemes (cont) Type I (eg “Tycho” & “Kepler” SNRs) - no H in spectrum - Rate is one every 36 yr in our Galaxy Subdivided into three classes based on their spectra Type Ic - weak He lines in spectrum Type Ib - strong He lines in spectrum Type Ia - strong Si II (615nm) lines death of short-lived massive stars (similar to Type II) These are the ones of cosmological interest "explosion" of a White Dwarf (WD) star in a close binary which has reached the 1.4 solar-mass limit through accretion of material from the companion Bright ! Process yields same luminosity in all -> Fixed peak Luminosity -> measure distance
Classification Schemes (cont) Type Ia- turn out to be the most useful, these are the white dwarf nova/binary systems gone into SNe Type 1b and Type 1c were so-named due to spectral characteristics suggesting they were slight variations on the white dwarf style of SNe In fact WRONG! They are now believed to also be from massive stars like Type II SNe. Also show some variations between SNe of this type, making them less useful than Type Ia Summary: Massive stars yield Type 1b, 1c and II and have some use as distance indicators White dwarf binary systems yield Type 1a and are most useful as they are the most luminous (can see them in more distant galaxies) and most predictable in absolute brightness (luminosity).
Riess (2000) Acceleration !
Potential Problems with SNe Ia Use of SNe Ia as "standard candles" remains somewhat controversial Other problems (real or potential) include: - ideally the SN would be caught prior to the peak luminosity. obviously very difficult observationally. - reddening is notoriously difficult to measure towards SNe - lingering concerns that there is a significant spread in the peak luminosity. - zero point is not calibrated using the Local Group, rather using more distant galaxies - supernovae not available for all galaxies
Low-z SNe Ia & H0 Throughout the 1990s, technique of using SNe Ia as standard candles been refined. now understood they are NOT perfect standard candles: They do NOT constitute a perfectly homogeneous sub-class. Spectroscopic and photometric (light-curve) peculiarities are been noted with increasing frequency. However once the "peculiar" & highly-reddened objects removed from the sample, many astronomers consider SNe Ia to be "nearly perfect" standard candles Currently a large observational effort directed towards SNe Ia. Understanding will (hopefully) increase as a result.
SNe Ia for Cosmology (z < 0.1) By the mid 1990s, large number of SNe Ia been observed (& systematic errors thought sufficiently well understood) Can do cosmology... H0 = 60 to 70 km s-1 Mpc -1 (50 objects)
SNe Ia for Cosmology (z < 0.1) “Raw” data statistical error only Filippenko & Riess (2000) H0 = 65+/-2 km s-1 Mpc -1 (50 objects) “Corrected” data
Some of the Main Groups The High-z Supernova Search Team (HZT) led by Brian Schmidt (Mt Stromlo & Siding Springs Observatories) The Supernova Cosmology Project (SCP) led by Saul Perlmutter (Lawrence Berkley Laboratory) The Lick Observatory Supernova Search (LOSS) So why all the effort ? ...
Can we Measure acceleration/deceleration ? [written in 1995] To Quote Bothun (p. 59) "Indeed, some particularly optimistic groups hope to use [Type Ia SNe] as a means for estimating the deceleration parameter of the Universe by measuring the rate of change of H0 over look-back times of a few billion years" deceleration/acceleration parameter tells us whether universe expansion is speeding up or slowing down, hence the fate of the universe
What are we trying to do ? So if H0 does not change with time We expect all the data to lie along here Further/fainter than expected Low-z SNe Ia Brighter /closer than expected If expansion rate was lower in the past - distant objects should be closer than the H=constant case So data will be here High-z SNe Ia ? Filippenko & Riess (2000)
So, where’s the data? =1,L=0, qo=0.5 We see Acceleration ! Filippenko & Riess (2000)
Sne Ia for Cosmology (z > 0.1) However in the mid/late 1990s, as SNe 1a were detected out to greater distances (z > 0.1) became clear that the observed fluxes of SNe 1a at 0.3 < z < 0.8 were systematically lower than expected eg. for a critical density (matter-dominated) universe, & even for a constant-velocity (empty of matter) universe. The SNe must have gotten farther than expected for some epoch of the universe The universe appears to have been accelerating between the epoch equivalent to z ~ 0.5 and now ! i.e. expanding faster and faster !
Acceleration ! And Deceleration ! (?) Riess et al (2001) z-binned means 68,95,99% confidence contours The very latest results on a SN Ia at z=1.7 imply prior to z ~ 1 the universe appears to have been decelerating ! So early on, the universe expansion was slowing, then suddenly sped up
Where do they do this ? Primary search engine for both the High-z Supernova Search Team Supernova Cosmology Project is the CTIO 4m Blanco Telescope (near La Serena, Chile) Large-format CCDs
CTIO 4m Blanco Telescope altitude 2.2 km over-looking Pacific
LOTOSS instruments Primary search engine for the Lick Observatory and the Tanagra Observatory Supernova Search (LOTOSS) is the KAIT @ Lick Observatory, Mount Hamilton (just East of San Jose, Ca),
KAIT Katzman Automatic Imaging Telescope 76cm entirely automatic telescope almost solely used to the search for Sne images of 1000 galaxies/night automatically reobserves best candidates undergrads examine candidates 9 SNe in 2002 Jan 6 SNe in 2002 Feb (so far)
Follow-up Spectra Using one of the 10m Keck telescopes (Mauna Kea, Hawa’ii) and/or Hubble Space Telescope, + ...
How do they do this ? Search: Compare 2 images looking for differences - automated & human filtering Spectra: Confirm ID as a SN 1a Light curves: Multi-color to determine reddening & as part of light-curve fitting technique Luminosity: Measured using PSF fitting, or multi-aperture photometry Calibrate: Using nearby SNe 1a Details differ between groups, but results are consistent
Warning ! This is cutting-edge observational cosmology - Implications are by no means universally accepted - New results possible at any time ... Introduced to give you a taste of the latest ideas (why we do all this) - Please no complaints if it turns out wrong ! (Basic ideas might be examined [unless I tell you otherwise]) As mentioned earlier, following Edwin Hubble’s results it took 30 years to realize calibration of the Cepheid Variables was wrong... Lev Landau Cosmologists are often in error, but never in doubt
Potential Problems (Gray Dust) At the present time, the main concerns seem to be: "Gray Dust" screen absorption that does not have characteristics to enable easy detection (e.g. does NOT "redden" the spectrum). - screen absorbs some of the light from the SNe1a, making them appear dimmer than they actually were. - Indeed offers an alternative explanation to acceleration for the faintness of the SNe Ia with 0.5 < z < 1 - expect the amount of absorption to increase with distance (z) thus does NOT offer a simple explanation of brighter-then-expected SNe Ia at z=1.7
Potential Probs (Lumin Evolution) "Luminosity Evolution" There is currently limited theoretical understanding of SNe Ia and their progenitors. According to Reiss et al (2001), "the weight of the empirical evidence appears to disfavor evolution as an alternative to" acceleration for the faintness of the SNe Ia with 0.5 < z < 1 However, they also say "the case against evolution remains short of compelling" (Reiss et al 2001).
Problem - Small Statistics believe it ? 25% fainter
Acceleration ! if so, also believe this ? 68,95,99% confidence contours
Other ‘Standard Candles’ We have reviewed the most reliable and (thus) widely-used distance determinations. There exist a variety of other types of object which usually have some determinable luminosity, these can be used to confirm and tighten constraints on cosmological parameters. We note them here: -planetary nebulae (out to 20 Mpc, 7 million ly) -globular clusters (out to 5 Mpc, <2 million ly) Rungs 3 - 4 on our diagram
The PN Luminosity Function The distance indicator using the Planetary Nebula Luminosity Function (PNLF) (Luminosity function is a plot of number of PNs versus luminosity) uses fact that all (currently detectable) PNs appear to lie in a similar range of mass, with a cut-off (at the high-end) so the ionizing flux & hence the strength of photoionized line such as [OIII] (500.7nm) will have a cut-off in strength (flux) By constructing a LF of all the PN in a galaxy, one can determine the cut-off flux then use a calibrated PNLF to calculate the distance
PNLF - Limitations/Potential Problems the calibration (or "zero-point") is based on PNs in M31 (not our Galaxy) concerns about the number of stars (& hence PNs) required to properly define the LF. concerns about subtle effects due to differences (from galaxy to galaxy) in average ionization of [OIII] but it seems to work out to 20 Mpc H0 = 75 km s-1 Mpc -1 (NGC 3379, Ciardullo, PSU) H0 = 73+/-10 km s-1 Mpc -1 (Jacoby 1992)
The GC Luminosity Function There is a distance indicator using the Globular Cluster Luminosity Function (GCLF) M13-Hercules Recap: Globular Clusters Group of 10,000-1 million ‘old’ (Pop II) stars (10-15 billion years) , bound by gravity, in galaxy halo. Metal poor.
The GC Luminosity Function The distance indicator using the Gobular Cluster Luminosity Function (GCLF) Uses assumption that the GCLF is universal (same everywhere) So comparing the Flux of the peak (in a distance galaxy) with a (calibrated) Luminosity of the universal peak gives the distance Number Brightness GCLFs from Nielsen (1998)