Download
1 / 23
230 likes | 241 Vues
This study examines the accuracy and usefulness of a 1km model in forecasting rainfall events on the scales of river catchments. The verification approach involves comparing the model forecasts against radar data, using accumulation exceedance thresholds. The results show that the 1km model provides more accurate spatial distribution of rainfall compared to the 12km model. Skills scores and skill improvement at different scales are also evaluated.

E N D
Scale selective verification of precipitation forecasts Nigel Roberts and Humphrey Lean
Background - What do we want to know? 1km model – should improve precipitation forecasts …. But, smaller scales are less predictable (Zhang et al 2003) – yet higher expectation Can a 1-km model provide more accurate and useful forecasts of rainfall events on the scales of river catchments? On what scales should the output be presented? What does data assimilation do to different scales?
Verification approach Verify against radar – good spatial coverage. Stable network over UK. Verify accumulations - smooth out temporal noise. Use accumulation exceedance thresholds e.g. > 4 mm, > 8 mm …. Verify over different spatial scales using a conceptually simple approach. Fractions/probabilities from nearest neighbouring points. (also Ebert)
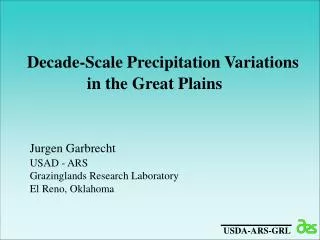
Radar 12 km forecast 1 km forecast The problem we face Six hour accumulations 10 to 16 UTC 13th May 2003 0 100 km 0.125 0.5 1 2 4 8 16 32 mm
Six hour accumulations 10 to 16 UTC 13th May 2003 1-km forecast Radar 0.125 0.5 1 2 4 8 16 32 mm
> 4 mm > 4 mm 4 mm threshold, Fractions at grid scale (1 or 0) Model Radar 0 0.1 0.2 0.3 0.4 0.5 0.6 0.7 0.8 0.9 Fraction
> 4 mm > 4 mm 4 mm threshold, Fractions within 35x35 km squares Model Radar 0 0.1 0.2 0.3 0.4 0.5 0.6 0.7 0.8 0.9 Fraction
4 mm threshold, Fractions within 75x75 km squares Model Radar 0 0.1 0.2 0.3 0.4 0.5 0.6 0.7 0.8 0.9 Fraction
4 mm threshold, Fractions within 105x105 km squares Model Radar 0 0.1 0.2 0.3 0.4 0.5 0.6 0.7 0.8 0.9 Fraction
Skill score for fractions/probabilities - Fractions Skill Score (FSS) A score for comparing fractions with fractions Brier score for comparing fractions
Evaluation of precipitation forecasts from a 1km NWP forecast model 11 convective cases (Summer 2003/2004) 44 forecasts out to T+7 12km with data assimilation (3-hour cycle) Concentrating on 1km spun up from 12km fields at T+1 (no additional data assimilation at 1km)
Scale selective evaluation of operational 12km modelprecipitation forecasts during 2003 hourly accumulations
Conclusions about the approach • Verification approach is useful • the concept is intuitively easy to understand • gives information about spatial accuracy • links output products to verification • agreement with subjective assessment • Issues …. • choice and interpretation of scores, dealing with a bias • radar is regarded as ‘truth’! • variability from case to case • should be compared with other approaches – e.g. Barbara Casati
Conclusions about the results • Forecasts of the spatial distribution of rainfall are more accurate at 1km than 12km at scales > ~20-30km. • The scale at which satisfactory skill is achieved is improved at 1km. e.g. from 70km (12km model) to 55km (1km model) for a 10% threshold • The more isolated the events being predicted the poorer the forecast skill, however the 1km model gave the greatest improvement for the most isolated events. • The impact of resolution is greater for hourly than for 6-hourly accumulations. Skill at 1km is maintained after the spin-up period. • Operational 12km model - Skill drops off most quickly after the analysis time at the smallest scales (~ <100 km).
Scale selective evaluation of operational 12km modelprecipitation forecasts during 2003 localised widespread
Scale selective evaluation of operational 12km modelprecipitation forecasts during 2003