Download
1 / 16
160 likes | 449 Vues
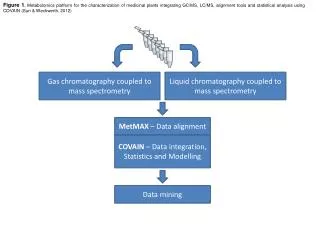
Figure 1 . Metabolomics platform for the characterization of medicinal plants integrating GC/MS, LC/MS, alignment tools and statistical analysis using COVAIN (Sun & Weckwerth, 2012). Gas chromatography coupled to mass spectrometry. Liquid chromatography coupled to mass spectrometry.

E N D
Figure 1. Metabolomics platform for the characterization of medicinal plants integrating GC/MS, LC/MS, alignment tools and statistical analysis using COVAIN (Sun & Weckwerth, 2012) Gas chromatographycoupledtomassspectrometry Liquid chromatographycoupledtomassspectrometry MetMAX – Data alignment COVAIN – Data integration, Statistics and Modelling Data mining
Figure 2. HPLC/ESI(OrbiTrap)/MS profile (full msmode) of the crude hydroalcoholicextract of P. anserina(positive ion mode) 7 9 15 10 16 12 6 8 13 3 11 14 4 1 2 17 5
3 Figure 3A. Sample patterns of the hydroalcoholic extracts of P.anserinaanalyzed by GC/MS. P. anserina UniVie 1 5 4 2 P. anserina UniSa
5 P. anserina UniSa Figure 3B.Scores plot of the hydroalcoholic extracts of P.anserinaanalyzed by LC/MS (only identified compounds used as variables). 3 1 P. anserina UniVie 2 4
1 • Figure 3C. Sample patterns of the hydroalcoholic extracts of P.anserinaanalyzed by LC/MS (all the compounds with RSD<25 used as variables). 4 P. anserina UniVie 5 P. anserina UniSa 2 3
Figure 4. Sample patterns of combined GC/MS and LC/MS data of the hydroalcoholic extracts of P.anserina.
Figure 5. Relative quantitative analysis of genistein in the commercial products (1, 2, 3, 4, 5) and in the two hydroalcoholic crude extracts of P. anserina. Intensity/total counts
Supplementary Figure 1.nanoLC/ESI(Orbitrap)/MS profile (full ms mode) of the crude hydroalcoholic extract of P. anserine and its commercial products (positive ion mode)
Supplementary Figure 2.GC/EI(TSQ)/MS profile (full ms mode) of the crude hydroalcoholic extract of P. anserinaand its commercial products (positive ion mode)
Supplementary Figure 3.Loadings plot of the hydroalcoholic extracts of P.anserina analyzed by GC/MS.
Supplementary Figure 4.Loadings plot of the hydroalcoholic extracts of P.anserina analyzed by LC/MS (identified compounds).
SupplementaryFigure 5 .Rt, LC/MS and LC/MSMS spectra comparison between reference standards and P. anserinahydroalcoholic extract compounds.A:chlorogenic acid, [M+Na]+: 377; B: genistein, [M+H]+: 271; C: quercetin 3-O-glucoside, [M+H]+: 465; D: kaempferol 3-O-glucoside, [M+H]+: 449; E: myricetin 3-O-rhamnoside [M+H]+: 465; F: quercetin 3-O-glucuronide [M+H]+: 479
A B C
D E F