Factor markets
Figure 1. Farm-households allocate resources to farm and non-farm uses and source inputs from multiple farm, household, and non-farm businesses. increasing scale risk management chain management by contracts transaction costs shapes structure separation management and work.

Factor markets
E N D
Presentation Transcript
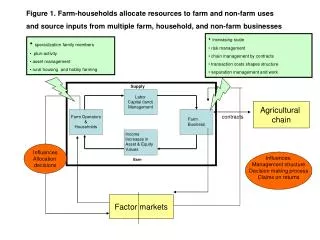
Figure 1. Farm-households allocate resources to farm and non-farm uses and source inputs from multiple farm, household, and non-farm businesses • increasing scale • risk management • chain management by contracts • transaction costs shapes structure • separation management and work • specialization family members • pluri-activity • asset management • rural housing and hobby farming Agricultural chain contracts Influences Allocation decisions Influences: Management structure Decision making process Claims on returns Factor markets
Figure 2. Farm Organizational/Governance Structures May Range from One to Many Owners and Operators Farm Management Structure Principal operator Farm Ownership Structure Principal operator’s spouse Household: principal operator Principal operator’s household members Households: family members Operators outside principal operator’s household, e.g.,partners, shareholders Household: non-family members Businesses and other entities Hired operators or managers Informal participants or other managers Business Arrangements Introduce Participants to Decision Making Process Farm Organizational/ Governance Structure Organizational structure affects claims on returns -- Owners: from one to many • Fixed return or payment • Physical output claim • Wages & dividends • Net income Joint ownership and other ventures -- Managers/Operators: from one to many -- Contracts/business arrangements may alter decision processes Contracts
Figure 3. Distribution of farms by type of legal organization and number of households sharing in net income of the farms Source: Agricultural Resource Management Survey, 2007
Figure 4.Number of households per farm by operating arrangement, Canada
Figure 5. Distribution of farms by type of legal organization and number of households sharing in net income of the farms in the Netherlands Source: Dutch FADN, 2007
Figure 6. Number of locations (farm addresses) per farm business, the Netherlands, 2003 – 2007 Source: Dutch FADN, 2007
Figure 7. Number of households sharing net income, United States, 2007 Source: Agricultural Resource Management Survey, 2007. C-corporation and S-corporation are specific legal forms of incorporation available to business owners in the U.S. S-corporations are typically viewed as small business corporations
Figure 8. Farms by legal status and number of owners, Italy, 2006 Source: Italian FADN, 2006
Figure 9. Distribution of farm business owners by number of households associated with the farm, United States, 2007 Source: Agricultural Resource Management Survey, 2007
Figure 10.Share of farm owners that are part of the primary operator’s household, United States, 2007 Source: Agricultural Resource Management Survey, 2007
Figure 11. Distribution of farm businesses by number of households associated with the farm, The Netherlands, 2007 Source: Dutch FADN, 2007
Figure 12. Farms exhibit a variety of persons engaged in daily decision making, United States, 2007 Source: Agricultural Resource Management Survey, 2007
Figure 13. Farms with more entrepreneurs have the majority of production, the Netherlands, 2007 Source: Dutch FADN, 2007
Figure 14. Distribution of commercial farms by number of operators and legal status, Italy, 2006 Source: Italian FADN, 2006
Figure 15. Conceptual Constructs of Family and General Business Organizational Structures Panel A Panel B A typical corporation Overlap of Family, Ownership, and Management Groups Owner Owners 2 6 5 7 Board ofdirectors 1 3 4 Managers & Employees Management/employees FamilyMembers 1 = Just management/employees2 = Just owner3 = Just board of directors4 = Management-board of directors5 = Management-owners6 = Owners-board of directors7 = Management-owners-board of directors Source: Tagiuri and Davis, 1996 Source: Neubauer & Lank, 1998
Figure 16. Farms include a range of owners and daily decision makers in business governance-decision structures, United States, 2007 Source: Agricultural Resource Management Survey, 2007
Figure 17. Number of households sharing net income of farms by the number of operators on a farm, 2007 Source: 2007 U.S. Census of Agriculture
Figure 18. Share (%) of the types of farms by legal organization in production, subsidies and total flow of funds (investment capacity) the Netherlands, 2007 Source: Dutch FADN, 2007
Figure 19. Total family farm income, internal cash flow and total flow of funds (investment capacity) in Euro per farm business by type of legal organization, the Netherlands, 2007 Source: Dutch FADN, 2007