Download
1 / 1
10 likes | 147 Vues
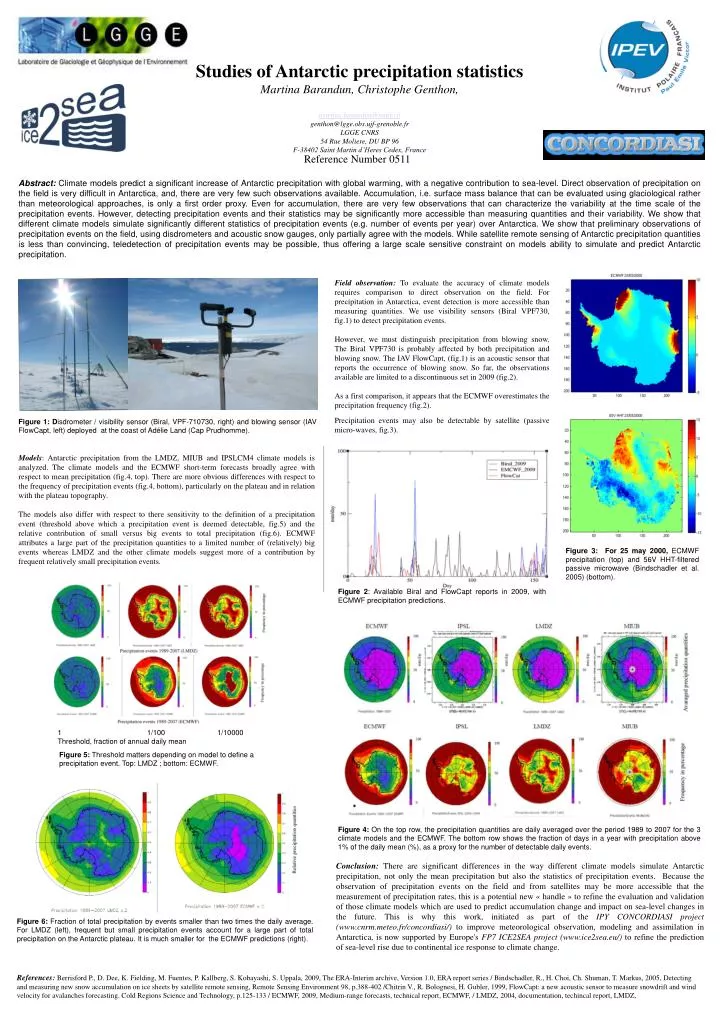
Studies of Antarctic precipitation statistics Martina Barandun, Christophe Genthon, martina.barandun@unifr.ch genthon@lgge.obs.ujf-grenoble.fr LGGE CNRS 54 Rue Moliere, DU BP 96 F-38402 Saint Martin d’Heres Cedex, France. Reference Number 0511.

E N D
Studies of Antarctic precipitation statistics Martina Barandun, Christophe Genthon, martina.barandun@unifr.ch genthon@lgge.obs.ujf-grenoble.fr LGGE CNRS 54 Rue Moliere, DU BP 96 F-38402 Saint Martin d’Heres Cedex, France Reference Number 0511 Abstract: Climate models predict a significant increase of Antarctic precipitation with global warming, with a negative contribution to sea-level. Direct observation of precipitation on the field is very difficult in Antarctica, and, there are very few such observations available. Accumulation, i.e. surface mass balance that can be evaluated using glaciological rather than meteorological approaches, is only a first order proxy. Even for accumulation, there are very few observations that can characterize the variability at the time scale of the precipitation events. However, detecting precipitation events and their statistics may be significantly more accessible than measuring quantities and their variability. We show that different climate models simulate significantly different statistics of precipitation events (e.g. number of events per year) over Antarctica. We show that preliminary observations of precipitation events on the field, using disdrometers and acoustic snow gauges, only partially agree with the models. While satellite remote sensing of Antarctic precipitation quantities is less than convincing, teledetection of precipitation events may be possible, thus offering a large scale sensitive constraint on models ability to simulate and predict Antarctic precipitation. Field observation: To evaluate the accuracy of climate models requires comparison to direct observation on the field. For precipitation in Antarctica, event detection is more accessible than measuring quantities. We use visibility sensors (Biral VPF730, fig.1) to detect precipitation events. However, we must distinguish precipitation from blowing snow. The Biral VPF730 is probably affected by both precipitation and blowing snow. The IAV FlowCapt, (fig.1) is an acoustic sensor that reports the occurrence of blowing snow. So far, the observations available are limited to a discontinuous set in 2009 (fig.2). As a first comparison, it appears that the ECMWF overestimates the precipitation frequency (fig.2). Precipitation events may also be detectable by satellite (passive micro-waves, fig.3). Figure 1: Disdrometer / visibility sensor (Biral, VPF-710730, right) and blowing sensor (IAV FlowCapt, left) deployed at the coast of Adélie Land (Cap Prudhomme). Models: Antarctic precipitation from the LMDZ, MIUB and IPSLCM4 climate models is analyzed. The climate models and the ECMWF short-term forecasts broadly agree with respect to mean precipitation (fig.4, top). There are more obvious differences with respect to the frequency of precipitation events (fig.4, bottom), particularly on the plateau and in relation with the plateau topography. The models also differ with respect to there sensitivity to the definition of a precipitation event (threshold above which a precipitation event is deemed detectable, fig.5) and the relative contribution of small versus big events to total precipitation (fig.6). ECMWF attributes a large part of the precipitation quantities to a limited number of (relatively) big events whereas LMDZ and the other climate models suggest more of a contribution by frequent relatively small precipitation events. Figure 3: For 25 may 2000, ECMWF precipitation (top) and 56V HHT-filtered passive microwave (Bindschadler et al. 2005) (bottom). Figure 2: Available Biral and FlowCapt reports in 2009, with ECMWF precipitation predictions. 1 1/100 1/10000 Threshold, fraction of annual daily mean Figure 5: Threshold matters depending on model to define a precipitation event. Top: LMDZ ; bottom: ECMWF. Figure 4: On the top row, the precipitation quantities are daily averaged over the period 1989 to 2007 for the 3 climate models and the ECMWF. The bottom row shows the fraction of days in a year with precipitation above 1% of the daily mean (%), as a proxy for the number of detectable daily events. Conclusion:There are significant differences in the way different climate models simulate Antarctic precipitation, not only the mean precipitation but also the statistics of precipitation events. Because the observation of precipitation events on the field and from satellites may be more accessible that the measurement of precipitation rates, this is a potential new « handle » to refine the evaluation and validation of those climate models which are used to predict accumulation change and impact on sea-level changes in the future. This is why this work, initiated as part of the IPY CONCORDIASI project (www.cnrm.meteo.fr/concordiasi/) to improve meteorological observation, modeling and assimilation in Antarctica, is now supported by Europe's FP7 ICE2SEA project (www.ice2sea.eu/) to refine the prediction of sea-level rise due to continental ice response to climate change. Figure 6:Fraction of total precipitation by events smaller than two times the daily average. For LMDZ (left), frequent but small precipitation events account for a large part of total precipitation on the Antarctic plateau. It is much smaller for the ECMWF predictions (right). References: Berrisford P., D. Dee, K. Fielding, M. Fuentes, P. Kallberg, S. Kobayashi, S. Uppala, 2009, The ERA-Interim archive, Version 1.0, ERA report series / Bindschadler, R., H. Choi, Ch. Shuman, T. Markus, 2005, Detecting and measuring new snow accumulation on ice sheets by satellite remote sensing, Remote Sensing Environment 98, p.388-402 /Chitrin V., R. Bolognesi, H. Gubler, 1999, FlowCapt: a new acoustic sensor to measure snowdrift and wind velocity for avalanches forecasting. Cold Regions Science and Technology, p.125-133 / ECMWF, 2009, Medium-range forecasts, technical report, ECMWF, /LMDZ, 2004, documentation, techincal report, LMDZ,