
N400 Congruity Effect in ERP Responses: Topographic Maps for Normal, MCI Stable, and Converters
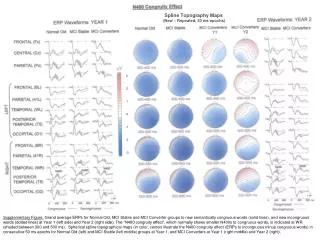
This supplementary figure presents grand average ERPs for Normal Old, MCI Stable, and MCI Converter groups in response to new semantically congruous and incongruous words over two years. The N400 congruity effect, observed as smaller N400 responses to congruous words, is highlighted at WR (300-500 ms). Spherical spline topographical maps are provided in color, depicting this effect across consecutive 50 ms epochs. The comparisons at Year 1 and Year 2 reveal changes in processing patterns among the different groups.

N400 Congruity Effect in ERP Responses: Topographic Maps for Normal, MCI Stable, and Converters
E N D
Presentation Transcript
Spline Topography Maps (New – Repeated, 50 ms epochs) 3 2 1 0 -1 -2 -3 Supplementary Figure. Grand average ERPs for Normal Old, MCI Stable and MCI Converter groups to new semantically congruous words (solid lines), and new incongruous words (dotted lines) at Year 1 (left side) and Year 2 (right side). The “N400 congruity effect”, which normally shows smaller N400s to congruous words, is indicated at WR (shaded between 300 and 500 ms). Spherical spline topographical maps (in color, center) illustrate the N400 congruity effect (ERPs to incongruous minus congruous words) in consecutive 50 ms epochs for Normal Old (left) and MCI Stable (left middle) groups at Year 1, and MCI Converters at Year 1 (right middle) and Year 2 (right).