Download

1 / 42
420 likes | 582 Vues
Einar Hjörleifsson. Structure in fisheries data: commercial catches and surveys – a case history of the Icelandic cod. Measurements: The basis for any assessment. Measurements of commercial catch composition Total catch Landings Discards Catch composition Size (length) Age

E N D
Einar Hjörleifsson Structure in fisheries data: commercial catches and surveys – a case history of the Icelandic cod
Measurements: The basis for any assessment Measurements of commercial catch composition Total catch Landings Discards Catch composition Size (length) Age Catch curve of a year class Independent measurements (surveys) Total indices Survey size composition Length based indices Age based indices Survey “catch” curve of a year class Correlation among commercial data and scientific surveys
Catches are taken by different gear and in different location
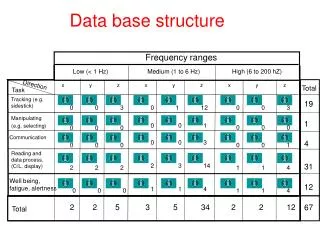
Sampling of catches need to reflect the actual fisheries Each letter refers to a sample from a single fishing activity (150-200 fish measured) Annual sampling: 500.000 length measures 20.000 age estimations
iCod – annual length distribution in the fishery 2001 2002 2003 2004 2005 2006 length 30 120 cm 60 90
iCod: Annual sampling from catches and age composition Catch composition in 2006:Annual landings is known. By sampling the catch composition (length and age) one can split the annual landings into landings by age groups.
Total yield and the yield of 5 year olds Food for thought: Yield of 5 year olds in 2006 at an all time historic low. Interannual changes in catch of 5 year olds much greater than changes in total landings 5 year old fish: 65-75 cm long
Age disaggregated yield 1982-2006 in kt The reason for high interannual variability in catches of 5 year old can be found if one follows catches by cohorts (year classes). Here the catch of the 1984 cohort is highlighted.
The yield of the 1984 year class yc 1984: Total yield: 510 kt
Age disaggregated yield 1982-2006 in kt Here the yield of the 1984 and 1985 cohort are highlighted. Note that for any particular age group the yield of the 1984 is always higher than in the adjacent 1985 cohort
The yield of the 1985 year class yc 1985: Total yield: 260kt
Yield of 1984 and 1985 year classes yc 1984: Total yield: 510 kt yc 1985: Total yield: 260kt
The yield of the 1996year class Total yield: 115 kt The yield from this year class is at an all time historical low. The sum of the yield from 3 to 10 year old is less than the yield of the 5 year olds from the 1984 year class landed in 1989!
The yield of the 1997year class Total yield: 280 kt
Yield by yearclasses Year class yield is very variable. In recent years (1980 onwards) the largest difference is fivefold Note: final yield of the most recent year classes is not known until it has passed through the fisheries
The yield of the 2001 yearclass What is the future yieldfrom this year class? Yield of 5 year olds in 2006 at an all time historic low. ??? ??? ???
The information in the commercial catches – when aged The inter-year-class yield can be highly variable The difference fivefold in recent years The pattern of the catch history among year classes is similar The yield increase from age 3 to age 5-6 and then declines This development is independent of the actual amount The decline in the catches of older age groups is a proxy for mortality Indication about likely yield in each year class become apparent right at age 3 and 4 If a lot of fish are cought as 3 and 4 year olds, one can expect that future yield from that year class will be high. And vice versa. The pattern observed and the amount give basis for making short term prediction on future catches based on catches alone. But what about predicting catches of year classes that have yet not appeared in the fisheries?
Scientific surveys: The Icelandic spring bottom trawl survey 550 stations taken per year Standardized approach 5000 cod aged and weighted 150 thousand cod length measured
iCod: Biomass and abundance indices Total biomass Biomass of >55 cm Biomass of >90 cm Abundance < 55 cm
Cod: Distribution and abundance of age 1 yc 1985 yc 1984 yc 1996 yc 1997 15 cm long
Cod: Distribution and abundance of age 2 yc 1985 yc 1984 yc 1996 yc 1997 25 cm long
Cod: Distribution and abundance of age 3 yc 1985 yc 1984 yc 1996 yc 1997 40 cm long
Distribution and abundance of selected year classes Yearclass 97 Yearclass 85 Yearclass 96 Yearclass 84 Age 115 cm Age 225 cm Age 340 cm
The information in the surveys – when aged The inter-year-class abundance is highly variable The pattern of the “catch” history among year classes is similar The abundance increases from age 1 to age 3-4 and then declines This development is independent of the actual amount The decline in the catches of older age groups is a proxy for mortality Indication about size of the year classes become apparent right at age 1 and 2 I.e. year class strength is determined at a relatively young age Scientific measurements of year class strength are obtained before the commercial fisheries know what is ahead The pattern observed and the amount give basis for making short term prediction on future stock development, independent of the commercial catches. But what about the link between the catches and the survey?
Development and magnitudes in the survey and the fisheries Yearclass 1985 Yearclass 1984 Survey Survey Indices Fisheries Fisheries Landings (kt)
Development and magnitudes in the survey and the fisheries Yearclass 1997 Yearclass 1996 Survey Survey Indices Fisheries Fisheries Landings (kt)
Survey indices and catches Age 2 Age 3 Landings (kt) Survey indices yc 84 yc 96 Age 1
Survey indices at age 3 and consecutive year class yield Year class yield (kt) Survey indices at age 3
Analytical stock assessment The assessment if iCod is based on two independent sets of measurements: Age disaggregated information of the commercial catches Age based survey indices from scientific surveys There is a relatively good consistency among the two sets of measurements Predicting the development in the short term can be done almost visually. A formal analytical model should be just a summary of the observations, where model assumption should have minimum influence. For the iCod, the assessment results are mostly data driven. In many cases, where data may be poorer, the results may be largely assumption driven.