Evaluation Framework, Design and Data Collection
Evaluation Framework, Design and Data Collection. Evaluation Questions and Construction of Evaluation Framework. Evaluation Questions—A Review Formative Summative Question : From WHERE do we derive our Evaluation Questions?. Evaluation Framework.

Evaluation Framework, Design and Data Collection
E N D
Presentation Transcript
Evaluation Questions and Construction of Evaluation Framework • Evaluation Questions—A Review • Formative • Summative • Question: From WHERE do we derive our Evaluation Questions?
Evaluation Framework • What are the key constructs that will be measured? • What changes am I hoping to find? • What do I need to know about the strategies and content used in professional development? • Who has the information I need to collect? • How will I gather the information I need from each source? • What tools or processes will I use to gather the information I need?
Evaluation Framework Components • Program Goals • Measurable Objectives • Information/Data Needed • Data Source • Data Collection Strategy • Data Analysis Plan • Timeline
Creation of Evaluation Framework Question: What do we consult to develop the Evaluation Framework?
Putting the Pieces Together Theory of Change Logic Model Evaluation Framework
Questions to ask of your Logic Model: • What key concepts will be measured? • How will those key concepts be measured? • How will data from those measures be analyzed to construct the answer to your evaluation questions?
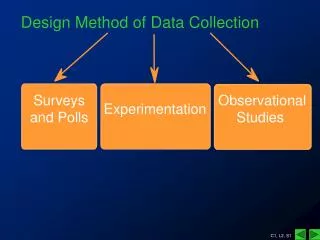
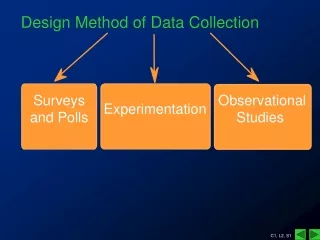
Evaluation Design: • Experimental • Quasi-experimental • Descriptive • Naturalistic • Case studies • Mixed-method
Quantitative vs. Qualitative Data: • Quantitative: Information that is measured and expressed in numbers. • Qualitative: Information that is measured and expressed in words.
Quantitative vs. Qualitative Data • Quantitative • Information that is measured and expressed with numbers (percents, ranges, averages) • i.e., Assessments, questionnaires, surveys • Qualitative • Information often expressed in words (grouped by theme, organized by topic, summarized by coding) • Document review, interviews, focus groups, observations
Descriptive vs. Inferential Statistics • Descriptive Statistics • Mathematical techniques for organizing and summarizing a set of numerical data. • Mean, median, mode, frequency distributions, percentages • Inferential Statistics • A set of mathematical procedures for generalizing the statistical results obtained from a sample to the population from which the sample was drawn. • Regression, ANOVA, MANOVA, t-test
Data Collection Methods: Considerations • How will results be used and what kind of impact will they have on people? • What indicators or questions are you attempting to answer? • Who will you collect data from to answer your questions? How will methods work/not work with specific populations?
Data Collection Methods: Overview • Existing data sources • Interviews • Surveys/Questionnaires • Assessments • Focus Groups • Observation
Documents • Strengths of documents and physical data: • Can provide insight into what people think and what they do. • Unobtrusive, making reactive and investigator effects very unlikely. • Can be collected for time periods occurring in the past (e.g., historical data). • Provides useful background and historical data on people, groups, and organizations. • Useful for corroboration. • Grounded in local setting. • Useful for exploration.
Documents • Weaknesses of documents and physical data: • May be incomplete. • May be representative only of one perspective. • Access to some types of content is limited. • May not provide insight into participants’ personal thinking for physical data. • May not apply to general populations.
Archived Research Data • Strengths of archived research data: • Archived research data are available on a wide variety of topics. • Inexpensive. • Often are reliable and valid (high measurement validity). • Can study trends. • Ease of data analysis. • Often based on high quality or large probability samples.
Archived Research Data • Weaknesses of archived research data: • May not be available for the population of interest to you. • May not be available for the research questions of interest to you. • Data may be dated. • Open-ended or qualitative data usually not available. • Many of the most important findings have already been mined from the data.
Interviews • Strengths of interviews • Good for measuring attitudes and most other content of interest. • Allows probing and posing of follow-up questions by the interviewer. • Can provide in-depth information. • Can provide information about participants’ internal meanings and ways of thinking. • Closed-ended interviews provide exact information needed by researcher. • Telephone and e-mail interviews provide very quick turnaround. • Relatively high response rates are often attainable. • Useful for exploration as well as confirmation.
Interviews • Weaknesses of interviews • In-person interviews usually are expensive and time consuming. • Reactive effects (e.g., interviewees may try to show only what is socially desirable). • Investigator effects may occur (e.g., untrained interviewers may distort data because of personal biases and poor interviewing skills). • Interviewees may not recall important information and may lack self-awareness. • Perceived anonymity by respondents may be low. • Data analysis can be time consuming for open-ended items. • Measures need validation.
Surveys/Questionnaires • Strengths of questionnaires • Good for measuring attitudes and eliciting other content from research participants. • Inexpensive (especially mail questionnaires and group administered questionnaires). • Can provide information about participants’ internal meanings and ways of thinking. • Quick turnaround. • Can be administered to groups. • Perceived anonymity by respondent may be high. • Closed-ended items can provide exact information needed by researcher. • Open-ended items can provide detailed information in respondents’ own words. • Ease of data analysis for closed-ended items. • Useful for exploration as well as confirmation.
Surveys/Questionnaires • Weaknesses of questionnaires • Usually must be kept short. • Reactive effects may occur (e.g., interviewees may try to show only what is socially desirable). • Nonresponse to selective items. • People filling out questionnaires may not recall important information and may lack self-awareness. • Response rate may be low for mail and email questionnaires. • Open-ended items may reflect differences in verbal ability, obscuring the issues of interest. • Data analysis can be time consuming for open-ended items. • Measures need validation.
Assessments • Strengths of tests (especially standardized tests) • Can provide measures of many characteristics of people. • Often standardized (i.e., the same stimulus is provided to all participants). • Allows comparability of common measures across research populations. • Strong psychometric properties (high measurement validity). • Many tests can be administered to groups which saves time. • Can provide “hard,” quantitative data. • Tests are usually already developed. • A wide range of tests is available (most content can be tapped). • Response rate is high for group administered tests. • Ease of data analysis because of quantitative nature of data.
Assessments • Weaknesses of tests (especially standardized tests) • Can be expensive if test must be purchased for each research participant. • Reactive effects such as social desirability can occur. • Test may not be appropriate for a local or unique population. • Open-ended questions and probing not available. • Tests are sometimes biased against certain groups of people. • Nonresponse to selected items on the test. • Some tests lack psychometric data.
Focus Groups • Strengths of focus groups • Useful for exploring ideas and concepts. • Provides window into participants’ internal thinking. • Can obtain in-depth information. • Can examine how participants react to each other. • Allows probing. • Most content can be tapped. • Allows quick turnaround.
Focus Groups • Weaknesses of focus groups • Sometimes expensive. • May be difficult to find a focus group moderator with good facilitative and rapport building skills. • Reactive and investigator effects may occur if participants feel they are being watched or studied. • May be dominated by one or two participants. • Difficult to generalize results if small, unrepresentative samples of participants are used. • May include large amount of extra or unnecessary information. • Measurement validity may be low. • Usually should not be the only data collection methods used in a study. • Data analysis can be time consuming because of the open-ended nature of the data.
Observational Data • Strengths of observational data • Allows one to directly see what people do without having to rely on what they say they do. • Can provide relatively objective measurement of behavior (especially for standardized observations). • Observer can determine what does not occur. • Observer may see things that escape the awareness of people in the setting. • Excellent way to discover what is occurring in a setting. • Helps in understanding importance of contextual factors. • Can be used with participants with weak verbal skills. • May provide information on things people would otherwise be unwilling to talk about. • Observer may move beyond selective perceptions of people in the setting. • Good for description.
Observational Data • Weaknesses of observational data • Reasons for observed behavior may be unclear. • Reactive effects may occur when respondents know they are being observed (e.g., people being observed may behave in atypical ways). • Investigator effects (e.g., personal biases and selective perception of observers) • Sampling of observed people and settings may be limited. • Cannot observe large or dispersed populations. • Some settings and content of interest cannot be observed. • Collection of unimportant material may be moderately high. • More expensive to conduct than questionnaires and tests. • Data analysis can be time consuming.
Spring 2008 Survey of MD Online IEP Users • Training Perceptions • Trained vs. Untrained • User Perceptions Related to the Student Compass Wizards • Frequency of Use of the Student Compass Wizards • User Perceptions Related to the Searchable VSC • Goal: The Student Compass Wizards within the Online IEP tool will increase the quality of IEPs developed by IEP End Users.
The percentage who agree or strongly agree that the content of the Wizards was helpful in the IEP development process: The percentage indicating that they always or sometimes use the *Goal Wizard when creating students’ goals: Summary of Findings: Spring 2007 to Spring 2008 • * Wizard usage dropped related to the Present Levels and Accommodations Wizards – these Wizards were released at a later date and were not accessible until mid-year.
Summary of Findings: Spring 2007 to Spring 2008 The percentage who agree or strongly agree that the searchable VSC increases access to the general education curriculum for students with disabilities: The percentage who agree or strongly agree that the searchable VSC promotes alignment of students’ goals to the general education curriculum:
Summary • There was a significant increase in the percentage of end users who see the value in the use of the Student Compass Wizards from 2007 to 2008. • The majority of MD OIEP users see the value in the Student Compass Wizards, but may need further PD to ensure proper implementation and increase frequency of use, as well as the perceived value of the student compass wizards. • The level of training that users perceive greatly affects the level of frequency of use. • The searchable VSC is a highly regarded component of MD OIEP that provides teachers with an efficient way for teachers to scaffold instruction to better provide students with disabilities access to the general education curriculum.
Evaluation Plan: Working Time • Work from your Theory of Change and Logic Model • Complete Evaluation Question Worksheet • Complete Evaluation Plan Worksheet
Tamara Otto Research and Evaluation Center for Technology in Education tamaraotto@jhu.edu