NASA SHARP CLOSING CEREMONY
NASA SHARP CLOSING CEREMONY. Combustion and Ignition of Energetic Nancomposites. Harrison Hsu Under supervision of Dr. E. L. Dreizin and A. Ermoline, New Jersey Institute of Technology. Nanocomposites. Mixtures blended on the scale of nanometers They are exceptionally homogeneous.

NASA SHARP CLOSING CEREMONY
E N D
Presentation Transcript
Combustion and Ignition of Energetic Nancomposites Harrison Hsu Under supervision of Dr. E. L. Dreizin and A. Ermoline, New Jersey Institute of Technology
Nanocomposites • Mixtures blended on the scale of nanometers • They are exceptionally homogeneous A nanocomposite A regular mixture
More about Nanocomposites • Produced by blending fine powders • Powders manufactured in ball mill • Nanocomposite powders can be pressed into easier-to-handle pellets Ball milling pictures from http://www.ilpi.com/inorganic/glassware/index.html
Reactive Nanocomposites • Nanocomposites have effectively infinite reaction surface area • They react faster and more intensely than macro-size composites • Can be: space propellant, explosive, incendiary
The Laser Chamber • A hermetically sealed chamber • Equipped with CO2 and red lasers • Data collection instruments: light and sound • Used to heat and ignite pellets
First Project: Zirconium • The phase chemistry of Zr with N and O is not well-known • Research could lead to discovery of new materials, particularly explosives and propellants A diagram of the compositions used
Current Results • Local heating is currently possible • Multiple heatings a promising possibility • Compositions A, B, C, and E have been used so far Sphere-and-cylinder formation for uniform heating
Results (cont.) SEM reveals morphologies: Dendritic Spherical Inclusions Burn temperatures about 2000K
Second Project: Thermite • A reactive metal exchanges oxygen with an inert oxide for large energy release. • Aluminum-Iron • Aluminum-Molybdenum • Boron-Titanium Example Reaction: Al+Fe2O3 => Al2O3+Fe From http://www.chem.psu.edu/ncs/HalloweenShow2003.htm
Thermite Preparation • Arrested Reactive Milling • Milling cut short boosts reaction power and speed • Used to compare with conventional milling
Results • Pulsed Detonation • ARM releases more energy faster than the blend • Frequent saturation of camera
Future Research • Added Variables: • Temporary levitation for ignitions • Teflon nanocomposite (CF2) n + Al) • New Pellet Binders • New formulations of Zr-O-N (D,F,G,H) • Applications of Technology: • Munitions • Propellant • Fuel
Analysis of Aerosol Particle Concentration Using MFRSR • Goddard Institute For Space Studies • The City College Of New York, Department of Electrical Engineering • Xavier Estevez
What are aerosols? • Air consists of molecules of N2, O2, CO2, and various other gases • Aerosols are fine solid or liquid particles suspended in a gas • Some examples of atmospheric aerosols are smoke, sulfates, volcanic ash, pollen, mold spores
Remote Sensing • Is the observation of some attribute of a subject by means that do not involve direct contact with that subject • In other words, “look don’t touch” • A familiar remote sensing system is that of your eyes and brain • Examples of remote sensing: weather radar, satellite imagery, climbing a mountain and looking at things, LIDAR, seismometers, telescopes, radio telescopes, x-rays, MRI. The applications are almost endless.
Remote Sensing of Aerosols Long wavelength light • In order to determine the concentration of aerosols in the atmosphere, we use optical remote sensing. • Aerosol particles reflect light. We can detect these particles by measuring the loss of intensity of light as it passes through an aerosol-bearing medium • Different wavelengths of light can detect different particle sizes. • Simply put, short wavelength light detects smaller particles, and long wavelength light detects larger particles Short wavelength light
What is the MFRSR? Multi-Filter Rotating Shadowband Radiometer • Multi-Filter • Senses several different wavelengths of light • Rotating Shadowband • Has a motorized arm thatperiodically covers the sensor • Radiometer • Measures intensity of solar radiation http://www.yesinc.com/products/data/mfr7/index.html
How Is It Used? MFR Laptop Control Unit / Data Acquisition System RS-232 • Data Acquisition System (DAS) controls the MFR, stores data in internal memory • Laptop is connected to the DAS to download the data • Data files are analyzed using various software tools
What Does It Tell Us? The moving shadowband allows one instrument to collect direct and diffuse intensity readings Data analysis tells us how much light is reflected by the atmosphere Variations in this amount are related to concentration of aerosol particles
Ig = intensity of sunlight as measured at the instrument I0 = intensity of sunlight outside of the atmosphere e = Napier’s constant m = airmass factor t = optical depth Beer’s Law The deeper the glass, the darker the brew, The less the amount of light that gets through Ig = I0 e–mt Loge Ig = Loge I0 – tm • The intensity of the light that reaches the earth’s surface is decreased by two factors– the length of its path through the atmosphere, and the optical properties of the atmosphere • The relationship can be modeled as a linear equation. • The slope of this line is equal to the total optical depth (how effectively the atmosphere blocks light)
Langley Regression Analysis • As the sun moves across the sky, sunlight must pass through varying amounts of air • The light’s path is shortest at noon, and longest at sunrise and sunset • Beer’s law tells us that there is a direct relationship between path length and light intensity– light that passes through a path twice as long is affected twice as much. • We assume that the optical depth of the atmosphere remains constant over a half-day period, and can therefore determine optical depth by plotting light intensity against path length (the secant of the solar zenith angle).
The optical depth for the time period in this graph is equal to the slope of the red line. The red line was not drawn mathematically, it “just looks right” This technique is not statistically valid, we have to use a linear regression equation to draw the trend line That regression applied to this data set would yield a line with a less severe slope and a lower y-intercept, due to the disproportionate effect of outlying points. Data Filtering Secant of solar zenith angle vs. Solar radiation intensity (W/m2/nm) 415 nm, afternoon of 22-June-2004
Linear Regression • Linear regression is a technique used to plot a straight line from a 2-dimensional collection of plotted data points • This allows one to model real-world data theoretically • The line produced will pass as closely as possible to as many of the data points as possible • The equation which returns the slope of the best-fit line is as follows:
Outcome • The final product of my research is a list of optical depths for approximately 70 days, and the Java application that I used to calculate these values. • I do not see any discernible patterns in these optical depths. They do not appear to conform to any linear or periodic functions as far as I can tell. • One potential source of error is the fact that due to cloudy or overcast conditions, some days did not yield any acceptable data-points, or yielded too few data-points to obtain any statistically valid trend • Another error source is the fact that even the best data-cleaning algorithm cannot determine with absolute certainty which readings are invalid.
References • “Atmospheric Aerosols: What are they, and why are they so important?” http://oea.larc.nasa.gov/PAIS/Aerosols.html • “Linear Regression”http://www.math.csusb.edu/faculty/stanton/probstat/regression.html • “Excel Tutorial On Linear Regression”http://phoenix.phys.clemson.edu/tutorials/excel/regression.html • “Langley Method”http://www.optics.arizona.edu/rsg/menu_items/resources/equip/langley.htm • “MFR-7 MULTI-FILTER ROTATING SHADOW BAND RADIOMETER”http://www.yesinc.com/products/data/mfr7/index.html
Supercritical Fluid Assisted Particle Synthesis Antoinette Kretsch New Jersey Institute of Technology
Supercritical CO2 Solvent enters system Collection trap Left over particles Exiting CO2 and solvent Supercritical Fluid Extraction
Analytical Techniques • Beckman Coulter N4 Plus: Submicron Particle Size Analyzer • determines particle size by measuring the rate of change in laser light intensity scattered by particles as they diffuse through a fluid • Leo 1530 VP: SEM Microscope • Produces 3-D image magnified x100,000 by spraying specimen with fine metal coating and sending beam of electrons over the surface to be projected onto fluorescent screen • SigmaScan: Systat software program • Collects data such as diameter and area of nanoparticles using pictures taken by the SEM • FTIR: Fourier Transform Infrared Spectroscopy • Used to identify chemical bonds in various substances by interpreting the infrared absorption spectra
Conclusions • A smaller nozzle will yield smaller, less agglomerated particles • A pressure closer to supercritical pressure (78 bar for CO2) will yield smaller particles, so 82 bar had smaller particles than 100 bar • The higher ratio of acetone to DCM will yield smaller particles with a narrow size distribution although the particles will have a distorted shape
Suggestions for Further Study • Can a stronger pump be used for force the solution through tinier micronozzles (ex: 10 μm and 5 μm)? • Is there a better way to increase yield of particles (particles stick to sides of, top of, and apparatus inside the collecting chamber and are hard to remove) and decrease amount lost to air? • What would the results be if another supercritical fluid was used instead of CO2? • Can the durability of the micronozzles be increased so they last more than one or two trials?
Skeletal Response to Weightlessness in the Female Murine Tibia Amy Brazin, NASA Apprentice Maria Squire, Ph.D. Candidate Stefan Judex, Ph.D. August 20, 2004
Metaphyseal BV/TV is 30% lower in disuse mice Metaphyseal Ct.Ar is lower by 15%as a result of a decrease in Ps.Ar and increase in Ec.Ar Yet, diaphyseal Ct.Ar was only minimally affected (3%)due to an insignificant increase in both Ps.Ar and Ec.Ar Example: Effects of Disuse are Site-Specific
If I had more time, I would…. • Analysis male F1 mice for similar effects in the tibia • Examine the osteoclast, osteoblast, and osteoid growth and population density in specific sites • Research other causes of bone loss such as hormonal secretions
Image Segmentation of Bone Density Images Rebecca Kamins
Quick Overview • Trying to find a deconvlution algorithm that will give us the real image. • g(x,y)= f(x,y)*h(x,y)+n(x,y) • We took a PSF (represents blur in a micro CT scanner) and altered it 3 ways. • Deconvolved the images using each PSF and analyzed the results
Results • Symmetrically rotated Gaussian PSF yielded the best results • Circular PSF good too- not the best
Future • Create 3D volume estimates of the mouse bones • Use pattern recognition to determine genetic trends in mice with bone loss • Write a code to be implemented in a micro CT scanner
Acknowledgements • Dr. John Daponte • Megan Damon • Michael Clark • Thomas Sadowski • Charles Tirrell • NASA SHARP • NASA GISS • SCSU
Enhancing Air Gap Membrane Distillation Melissa Deutsch In conjunction with the Goddard Institute for Space Studies at the New Jersey Institute of Technology Dr. Chao Zhu – professor of mechanical engineering Tong Lee, Qun Yu – PhD candidates Summer 2004
Distillation system used to extract chemically pure water from dirty water through a hydrophobic membrane Theoretically, pure water has a resistance of infinity, since it cannot conduct electricity This system produced water of 300kΩ resistance from an initial source feed of salt water at 90kΩ Huge jump in resistance of water shows that the system is largely effective in its end Found that the magnetic stirrer did little to increase both the rate of water production and the volume of water produced Larger temperature difference did produce a greater rate of production Hot side cavity is too large to effectively increase the rate of water production Folded membrane would make the system more feasible for use on a lunar base Vacuum pump necessary to increase rate of flow Research Findings
Future Work • Test the AGMD apparatus against various concentrations of dissolved particles (ie – NaCl, dyes) • Test the AGMD apparatus against various temperature gradients • Install an ultrasonic inducer to potentially enhance the effectiveness of the membrane distillation system • Build a new AGMD apparatus with a folded membrane module to increase flow rate • Introduce a vacuum into the air gap AGMD apparatus
York College Radio Telescope York College Radio Telescope York College Observatory Ian O’Leary Tim Paglione
Description • We will be receiving Radio waves from various sources. • Radio waves we are focusing on is the 21 cm hydrogen wave emissions. • Radio waves allow us to understand more about what we are focusing on. • Hydrogen gives creates a 21 cm wave when it moves from its excited state to its ground state.
Project Goals • Construction of a Radio Telescope. • Connections between telescope and computer (server). • Observe radio wave emissions from hydrogen emitting sources. ex: Sun (stars), Moon, and Galaxies • Record and plot all data found.
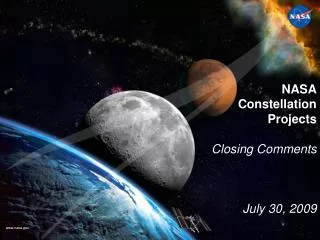
Personal Air Vehicle By Robert Brown and Nikhil Srivastava Contributions from: Dr. Siva Thangam
This is an artist's concept of a dual-mode road to air vehicle, a 'flying car.'
A Flying Car—What would it take? Concept • A “roadable” aircraft that gives people the option to drive or to fly Why? • Basically, a question of time • “Point to point mobility” can be dramatically increased with a dual-mode vehicle