Download
1 / 10
100 likes | 219 Vues
Variation in Volume-Outcome Relationships for Hospitals and Surgeons Performing CABG Surgery. Christopher P. Gorton MD, MHSA Jayne L. Jones MPH Christopher S. Hollenbeak PhD David B. Campbell MD Diane L. Arke MS. Research Objectives:.

E N D
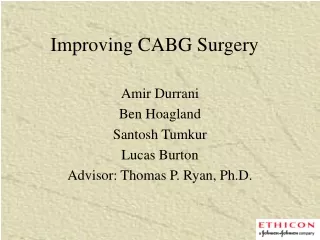
Variation in Volume-Outcome Relationships for Hospitals and Surgeons Performing CABG Surgery Christopher P. Gorton MD, MHSA Jayne L. Jones MPH Christopher S. Hollenbeak PhD David B. Campbell MD Diane L. Arke MS
Research Objectives: • To describe the variation in risk-adjusted outcomes for individual surgeons and hospitals with similar case volumes • To examine the association between case volume and two outcomes, 30-day mortality rates and 7-day readmission rates, for surgeons and hospitals
Methods Isolated CABG surgeries, 2002: 16,435 patients; 62 non-federal Pennsylvania hospitals; 190 surgeons Retrospective analysis of administrative and medical record abstracted data reflecting statewide experience. Generalized estimating equations (GEE) framework used to account for the correlations between patients treated by the same surgeons and at the same hospital.
Principal Findings • Wide variation was seen between and within outcome measures at all volume levels • Extreme mortality observations were demonstrated across the entire volume spectrum. • Likelihood of patient death within thirty days decreased as surgeon case volume increased (adjusted risk ratio [RR] for each 25 case increment, 0.93; 95% confidence interval [CI], 0.87-0.99; P=0.031).
Results of Simulated Policy of Referral to Mid-High Volume Surgeons • Modeled outcomes of 1,000 simulated choices in each of 8 regions, in which patients of low volume surgeons were reassigned to surgeons with mid-high volumes in the same region • Statewide Mortality Risk Ratio, Observed vs. Simulation: 1.080 (95% CI: 0.927 to 1.260) • With selective referral, predicted lives saved = 23, but 15.9% probability of increased lives lost
Probability Distribution of Predicted Lives Saved by Simulated Policy
Conclusions • For individual consumers, surgeon volume is a weak predictor of mortality and re-admission • Large scale implementation of a selective CABG referral policy has non-trivial probability of negative public health impact • Lack of correlation among four studied outcome measures highlights need for multi-dimensional performance measurement