Calculating the Probability of Observing Seals Using Z-Score and Normal Distribution
In this example, we explore how to calculate the probability of observing at most 50 seals during an aerial survey of a seal sanctuary. The number of seals is normally distributed with a mean of 73 and a standard deviation of 14.1. We will use the z-score formula to find the probability for the given number of seals and reference the standard normal table for our calculations. The resulting probability for observing 50 seals is approximately 0.0548, allowing us to understand the statistical behavior of seal observations.

Calculating the Probability of Observing Seals Using Z-Score and Normal Distribution
E N D
Presentation Transcript
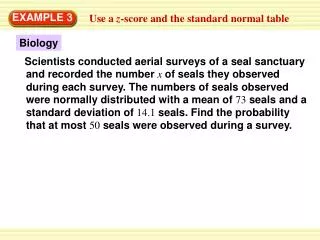
EXAMPLE 3 Use a z-score and the standard normal table Biology Scientists conducted aerial surveys of a seal sanctuary and recorded the number x of seals they observed during each survey. The numbers of seals observed were normally distributed with a mean of 73 seals and a standard deviation of 14.1 seals. Find the probability that at most 50 seals were observed during a survey.
x 50 – 73 –1.6 z = = 14.1 Use: the table to find P(x <50) P(z <– 1.6). x – EXAMPLE 3 Use a z-score and the standard normal table SOLUTION Find: the z-score corresponding to an x-value of 50. STEP 1 STEP 2 The table shows that P(z <– 1.6)= 0.0548. So, the probability that at most 50 seals were observed during a survey is about 0.0548.
EXAMPLE 3 Use a z-score and the standard normal table
ANSWER 0.8849 for Example 3 GUIDED PRACTICE 8. WHAT IF? In Example 3, find the probability that at most 90 seals were observed during a survey.
ANSWER Az-scoreof 0 indicates that thez-score and the mean are the same. Therefore, the area under the normal curve is divided into two equal parts with the mean and thez-score being equal to 0.5. for Example 3 GUIDED PRACTICE 9. REASONING: Explain why it makes sense that P(z< 0) = 0.5.