Download
1 / 18
180 likes | 265 Vues
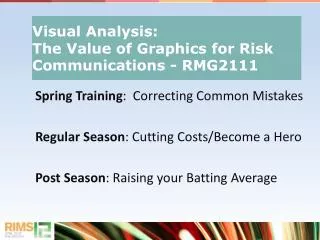
Spring Training : Correcting Common Mistakes Regular Season : Cutting Costs/Become a Hero Post Season : Raising your Batting Average. Naomi Robins Consultant and seminar leader on effective data presentation Principal, NBR Phone : (973) 694 - 6009 e-mail : Naomi@NBR-GRAPHS.com

E N D
Spring Training: Correcting Common Mistakes Regular Season: Cutting Costs/Become a Hero Post Season: Raising your Batting Average
Naomi Robins • Consultant and seminar leader on • effective data presentation • Principal, NBR • Phone: (973) 694 - 6009 • e-mail: Naomi@NBR-GRAPHS.com • Website: http://www.NBR-Graphs.com/ • Libby Christman • Vice President of Risk Management, Ahold USA • Phone: (717) 240 - 5573 • e-mail: lchristman@ahold.co • Website: http://www.Ahold.com/ • Richard Denning • President, Shelter Island Risk Services • Phone: (631) 749-1535 • e-mail: rfdenning@sirisk.com • Website: http://www.shelterislandrisk.com/
Improving Performance In The Post Season • Richard Denning • President, CEO • Shelter Island Risk Services
Adapted from T. H. Davenport, J. G. Harris, Competing on Analytics
Analytics Improve Your Batting Average • A fool is a person who expects different results when you do the same thing over and over.
Visualization deserves to move from the bottom of the batting order to clean-up Sloan Management Review: • 58% of organizations see analytics as a competitive advantage (2011 survey) • Up from 37% in 2010
Classes of Risk Data Critical Dates HR info on all Employees Exposures (Fleet size, miles driven, etc. Data Claim Measurements Data Organization
The Analytical Payoffs • Time • Control • Confidence
It’s a Team Sport • Bounce ideas off others who bring specialist skills and experience
The Danger of Numbers! Assume that your four Divisions: A, B, C and D All have the same average frequency rate of 5 claims per 100 employees
Inspiration for Better Graphics: Naomi B. Robbins, http://blogs.forbes.com/naomirobbins Wall Street Journal for financial reporting Sports Reporting for creative displays Edward R. Tufte, The Visual Display of Quantitative Information (two other volumes)
Software Visualization Tools (Excel compatible / not expensive) • Palisade Software @RISK • SAS Institute JMP • Tableau Software Tableau
Concentrating information is precisely how our brains work best: 16
CONCLUSION OPERATIONS COST ALLOCATION RISK SERVICES ANALYTICS