Download
1 / 19
190 likes | 332 Vues
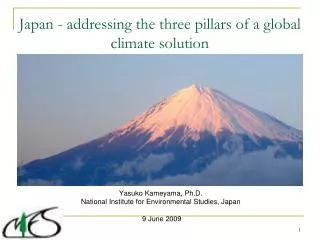
Japan - addressing the three pillars of a global climate solution. The Ny-Ålesund Symposium 2009 Yasuko Kameyama, Ph.D. National Institute for Environmental Studies, Japan 9 June 2009. Japan’s CO 2 Emissions (1990-2006). tCO2/capita. Mt/CO2. +6.2% from 1990 (6 gases). CO2 per capita.

E N D
Japan - addressing the three pillars of a global climate solution The Ny-Ålesund Symposium 2009 Yasuko Kameyama, Ph.D. National Institute for Environmental Studies, Japan 9 June 2009
Japan’s CO2 Emissions (1990-2006) tCO2/capita Mt/CO2 +6.2% from 1990 (6 gases) CO2 per capita Total CO2 emissions CO2 per capita Kyoto Target Total CO2 emissions
Japan’s CO2 emissions by sectors (1990-2005) Industry Transport Residential Commercial Power Industry Process Waste
Japan’s CO2 emissions by sectors (1990-2005) Graph from CAIT (2009)
Japan’s climate change policy after COP3 (1997) 1998 the “Law Concerning the Promotion of the Measures to Cope with Global Warming” enacted Amendment of the “Law Regarding the Rationalization of Energy Use” initially enacted in 1979 2001 Marrakesh Accords agreed at COP7 2002 Japan ratified the Kyoto Protocol 2005Kyoto Protocol entered into force Establishment of “Action Plan to Fulfill the Kyoto Target” 2007 Prime Minister Abe’s “Cool Earth 50” , a long-term goal to halve the global emission by 2050 2008 Prime Minister Fukuda established the “Council on Global Warming Issue” Fukuda proposed a vision so-called “Fukuda Vision”, which called for a stronger position on climate policy Hosted the G8 Summit at Toyako, discussed the long-term target Prime Minister Aso established the “Mid-term Target Committee” under the “Council on Global Warming Issue” Pilot-phase of domestic emissions trading scheme
Discussions made in the “Mid-term Target Committee”, October 2008- April 2009 Background Strong opposition from industry sector against the current Kyoto framework Industries’ view: (1) Kyoto Protocol is unfair because the U.S., the largest emitter, has withdrawn from it. (2) Kyoto Protocol is unfair because EU’s emission reduction target, 8%, is considerably easier to achieve than Japan’s target, 6%, due to some windfall profits such as reunification of Germany and shift from coal to gas in the United Kingdom. (3) Kyoto Protocol is unfair because some emerging economies such as China and India are not committed to emission reduction targets. A hard resistance to “Cap & Trade” type of institution for “beyond -2012” Industries’ group proposed a “Sectoral Approach” which basically was a voluntary “pledge & review” , at the time of COP13 in 2007
Discussions made in the “Mid-term Target Committee”, October 2008- April 2009 Jan. 2008 Prime Minister Fukuda generally accepted continuation of “cap&trade” institution and decided to set a mid-term target, but did not actually announce any national emission reduction target for the mid-term. Discussions made in the Mid-term Target Committee kicked off by discussing mainly “the equity concern from industries” Equity, in terms of “marginal abatement cost (MAC)” or “emission mitigation potentials” was considered by industries to be the most acceptable criteria to assure “comparability of efforts” among countries.
Relation between the mid- and long-term emission targets 1,358 (2005) 1,261 (1990) Option 1 (4% growth from 1990) Equal MAC, -25% by Annex I total (-5%) Option 2 (-7% from 1990) GHG emissions (Mt)CO2 eq. Option 3 (-15% from 1990) Option 4 All Annex I countries reduce -25% from 1990) Japan’s national long-term goal, -60-80% from current year
Emission reduction potentials in Japan: using marginal cost curve Change to smaller vehicle Indust Resid. Com. Transport. Agriculture F-gases Improving efficiency of cargo fleets Improving efficiency of vehicles Improving efficiency of house utilities Improving efficiency of air conditioners Improving efficiency of lighting Improving efficiency of lighting in offices Improving efficiency of mobility Improvement in air conditioning Pulp & paper Yen/tCO2 Fuel switching by industries Fuel switching in transportation DSM Waste management Improving efficiency of heating Steel Industry Shift to electric cars and hybrid cars Solar PV and wind power generation Thermal insulation of houses MtCO2 AIM Modeling Team 2009 Emission reduction cost in 2020 and amount of reduction
Policies to achieve emission reductions in various sectors Four pillars to achieve emission reduction target at 2020 Front-runner rule Visualization • Standardization for the highest energy efficiency • Strengthening the level of standards • .Bench marking Information easy to understand by consumers - Labeling for products , amount of GHG emissions - Information disclosure of GHG emissions Improvement of energy efficiency of automobiles and lighting, etc. Yen/tCO2 Emission reduction mainly in industry sector Cost of mitigation is high, but potentials for a new green business(automobiles, renewable energy, thermal insulation of buildings, etc.) MtCO2 Technology Development and Diffusion Price on Carbon Supporting technology development and diffusion - FIT for renewable energy - Government purchasing green consumption - Strengthening regulations for housing, etc. • Economic measures for cost-efficiency • Emissions trading • -Green Taxation AIM Modeling Team 2009
How should we measure “comparability of efforts” among countries? Japanese industries considered that “efforts” should be compared by “marginal abatement cost (MAC)” or “emission mitigation potentials”. This criteria could be eligible only when discussing targets for reducing domestic emissions from fossil fuel combustion. (A) The Kyoto target accepts inclusion of LULUCF and Kyoto Mechanisms (ET, JI, CDM) (B) Even if we are focusing on domestic emissions only, is MAC the best criteria to determine national emission reduction targets?
(A) The Kyoto Target: how to deal with purchasing AAUs, ERUs and CERs? AWG-KP refers to IPCC AR4 report, saying that “… would require Annex I Parties as a group to reduce emissions in a range of 25-40% below 1990 levels by 2020…”This target as a group needs to be achieved by reducing emissions in Annex I countries. Targets for each Annex I countries for amount of carbon units that could be obtained by ET, JI and CDM from other countries should be determined by economic capacity to purchase, such as GDP per capita. As a whole, criteria of responsibility, such as emission per capita, should also be considered.
Is “equalization of marginal abatement cost (MAC)” the best strategy to determine a reduction target for domestic emissions? Japanese products have had international competitiveness, due to its high energy efficiency. Equalizing MAC among countries might mean Japanese products losing such competitiveness. Innovative technology development may be promoted when the game of climate change mitigation is considered as a “race for the Green-New-Deal” economy, not “equal burden sharing”.
Research Project on Low Carbon Society, (http://2050.nies.go.jp/index.html ) Design: Akemi Imagawa
Japan’s 70% emission reduction by 2050 from 1990 level is technically achievable. LCS type A (LCS Project, 2008)
Considering “lock-in effects”: need for early actions! ・Because of lock-in effects, delay of actions leads to loss of opportunity to reduce emissions in the long-term. ・For example, according to a study by McKinsey & CO, 10 years’ delay of action to mitigate emissions (ex. Years 2010 → 2020) will reduce 40% of emission reduction potentials in 2030, and lose opportunity to reduce 280GtCO2between 2010-2030, because of lock-in effects in coal-burning power plants (life time 40-50 years), factories (20-30 years), automobiles (10-20years) , etc. ・By such delay of action, stabilization of atmospheric GHG concentrations at 450ppm, or even at 550ppm, will be very difficult to achieve. 10 year of delay Global emission path when actions taken only after 2020(60€/tCO2) Global emission path when actions taken in 2010and thereafter(60€/tCO2) 出典:Pathways to a Low-Carbon Economy Version 2 of the Global Greenhouse Gas Abatement Cost Curve (McKinsey&Company)2009
Summary • Japan has been failing to effectively introduce emission reduction policies, due to strong oppositions from industries against Kyoto Protocol, as well as lack of political leadership. • Because of the industries’ criticism on Kyoto Protocol, Japan has been reluctant to introduce “cap & trade” system. Debates on emission reduction targets are focused on MAC of domestic GHG emissions only. • The three (or four) pillars for solution can be implemented in an effective manner by analyzing emission mitigation potentials. • As long as compared by MAC, EU’s -20% and the U.S.’s stabilization target from 1990 by 2020 almost equal to Japan’s 4% from 1990. This means not only Japan but other developed countries also need to re-examine their targets, to be sufficient to reach the long-term target. • Time for early action. Change the game, from that of “burden-sharing” to “a race for the Green-New-Deal Economy”
Thank you! Yasuko Kameyama, Ph.D. , is responsible for the content of this presentation. For any questions, please contact ykame@nies.go.jp