Download
1 / 22
220 likes | 363 Vues
What are the measures of center? What are the measures of Spread? . Thursday, February 6 th. EOCT Week 4-# 4. Which statement is TRUE about the function? The function is always decreasing . The function values are always negative . The function has no maximum or minimum .

E N D
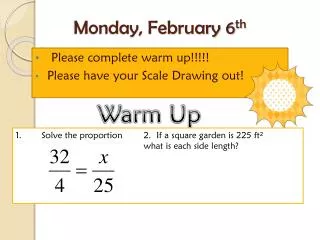
What are the measures of center? What are the measures of Spread? Thursday, February 6th
EOCT Week 4-#4 Which statement is TRUE about the function? The function is always decreasing. The function values are always negative. The function has no maximum or minimum. d. The range is {1}.
Quiz TOMORROW • Mean • Median • Mode • MAD • Range • IQR • Outliers Comparing Data
Homework Answers Goal: Outlier effecting measures of CENTER
Classwork Answers Goal: Comparing measures of center and spread
Remember! Measures of Center • Mean • Median • Mode *How CENTERED the data is Measures of Spread • Range • MAD • IQR *How SPREAD out the data is
Mean Median Mode Range MAD IQR
Steps to find the Interquartile Range 1. Arrange the data from least to greatest. 2. Find the median. 3. Find the median of the lower quartile, . 4. Find the median of the upper quartile, . 4. Find the difference between the quartiles.
Compare Centers: Compare Variance/Dispersion/Spread:
IQR On Calculator • Enter data into L1 • STAT- CALC-1VARS • Scroll down to see Q1 Q3 Find difference
Compare Centers: Compare Variance/Dispersion/Spread:
Compare Centers: Compare Variance/Dispersion/Spread:
Analyze Questions to Example 1: What are the outliers? 2. How has the outlier affected the center of the data? 3. How has the outlier affected the spread of the data?
Analyze Questions to Example 2: What are the outliers? 2. How has the outlier affected the center of the data? 3. How has the outlier affected the spread of the data?
Worktime • Ticket to Go • Homework