Download
1 / 20
520 likes | 1.33k Vues
Introduction to D3.js. CS 4390/5390 Data Visualization Shriley Moore, Instructor October 1 , 2014. Announcements. MATLAB Tutorial taught by Rogelio Long, rlong@miners.utep.edu, Thursday, Oct 2, 4:30-5:30pm, Bell Hall Computer Lab Room 130

E N D
Introduction to D3.js CS 4390/5390 Data Visualization Shriley Moore, Instructor October 1, 2014
Announcements • MATLAB Tutorial taught by Rogelio Long, rlong@miners.utep.edu, Thursday, Oct 2, 4:30-5:30pm, Bell Hall Computer Lab Room 130 • CS Seminar, Barry Rountree, LLNL, “Open Problems in Power-aware Supercomputing”, Friday, Oct 3, 10:30am, CCSB G.0208, followed by discussion with students about job opportunities at the national labs • CS Seminar, Zach Toups, NMSU, “Zero-Fidelity Simulation to Improve Team Coordination Learning”, Friday, Oct 3, 1:30pm, CCSB G.0208
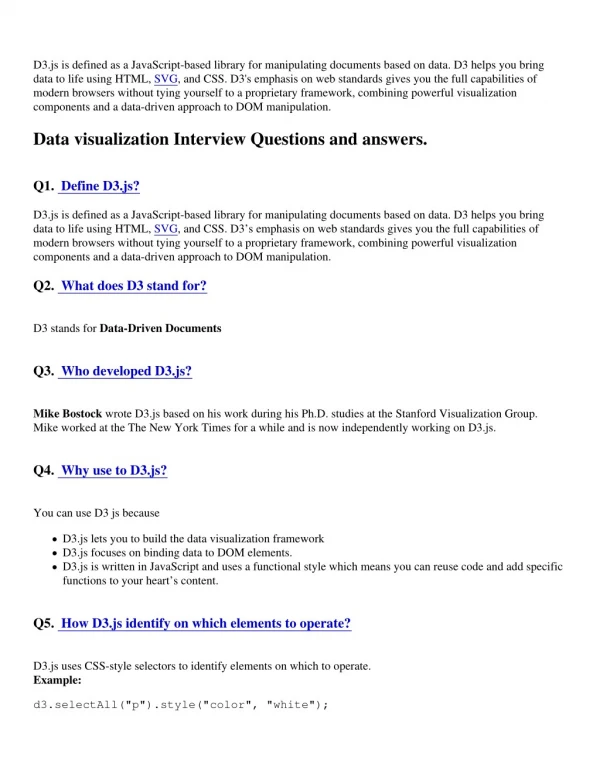
What is D3.js? • https://github.com/mbostock/d3/wiki • JavaScript library for manipulating documents based on data • Uses Web standards HTML, SVG, CSS • Has powerful visualization components • Reference: Interactive Data Visualization for the Web by Scott Murray, publ. O’Reilly
Web Topics • Working with D3.js requires an understanding of the following web topics: • HTML • DOM • CSS • JavaScript • SVG • Web browser developer tool
HTML • Hypertext Markup Language • Used to structure content for web browsers • Simple example webpage in HTML: <html> <head> <title>Page Title</title> </head> <body> <h1>Page Title</h1> <p>This is a really boring webpage.</p> </body> </html>
DOM • Document Object Model • Models hierarchical structure of HTML • Each tag is an element. • Elements have relationships such as parent, child, sibling. • In the HTML example • body is the parent of h1 and p • h1 and p are siblings • All elements on the page are descendents of html.
CSS • Cascading Style Sheets • Used to style the visual representation of HTML pages • Consists of selectors and rules • Can be included in head element within a style tag or saved in an external file and referenced using a link element • Simple CSS style sheet example: body { background-color: black; color: white; } • More examples at http://www.w3schools.com/css/css_howto.asp
JavaScript • Dynamic scripting language that can instruct the browser to make changes to a page after it has already loaded • Include directly in an HTML page inside script element or reference external file • Examples at http://www.w3schools.com/js/default.asp
SVG • Scalable Vector Graphics • Text-based image format • Specify how an SVG image should look by writing simple markup code • Example: <svg width=“50” height=“50” <circle cx=“25” cy=“25” r=“22” fill=“blue” stroke=“gray” stroke-width=“2”/> </svg>
Web Browser Developer Tools • Web inspector shows you the current state of the DOM • Watch elements as they change • Use JavaScript console for debugging scripts
To use D3.js • Download to your computer and reference local file <script src=“d3.v3.js”> </script> OR • Reference URL at d3js.org <script src=“http://d3js.org/d3.v3.min.js”> </script>
Use D3 to create a new DOM element <!DOCTYPE html> <html lang=“en”> <head> <meta charset=“utf-8”> <title>D3 Test</title> <script type=“text/javascript” src=“d3/d3.v3.js”></script> </head> <body> <script type=“text/javascript”> d3.select(“body”).append(“p”).text(“New paragraph!”); </script> <p>Original paragraph</p> </body> </html>
Binding Data • With D3, you can bind data values to elements in the DOM. • Example: var dataset = [5, 10, 15, 20, 25]; d3.select(“body”).selectAll(“p”) .data(dataset) .enter() .append(“p”) .text(function(d) { return(d) });
Map Data to SVG Circle Sizes • Assuming we have already created an svg element with width w and height h and saved it in variable svg: var circles = svg.selectAll(“circle”) .data(dataset) .enter() .append(“circle”); circles.attr(“cx”, function(d, i) { return(i*50+25);}) .attr(“cy”, h/2); .attr(“r”, function(d) { return(d) });
Bar Chart Using SVG • Class Exercise 1: Change the circle code to draw a bar chart. Make your code flexible enough to work with a different data array with a different length.
Scatterplot using SVG • Class Exercise 2: Now write a simple scatterplot visualization in D3.js to show the data below. (Hint: Plan the steps, then reuse parts of your circle and bar chart codes). var dataset = [ [ 5, 20 ], [ 480, 90 ] , [ 250, 50 ], [ 100, 33 ], [ 330, 95 ], [ 410, 12 ], [ 475, 44 ], [ 25, 67 ], [ 85, 21 ], [ 220, 88 ] ];
D3 Scales • We want our visualizations to be flexible so as to handle different datasets • D3 scales are functions that map from an input domain to an output range. • Example: var scale = d3.scale.linear() .domain([100, 500]) .range([10, 350]); What does scale(300) return?
Scatterplot 2 • Class Exercise 3: Now use D3 scales to generalize your scatterplot code to plot an arbitrary dataset.
D3 Axes • See example code scatterplot-with-axes.html on course website
Preparation for Next Class • Get basic SPLOM and parallel coordinates implementations in D3 working for Iris dataset • To read ahead: Munzner Chapter 9 Arrange Networks and Trees (Visualizing Graph Datasets)