Cross-lagged Panel Correlation (CLPC)
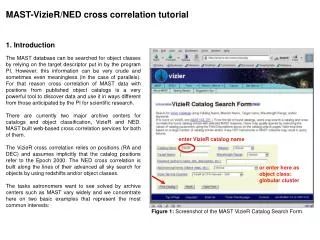
Cross-lagged Panel Correlation (CLPC). David A. Kenny. Example. Depression and Marital Satisfaction measured at two points in time. Four measured variables S 1 , S 2 , D 1 , and D 2. Causal Assumptions.

Cross-lagged Panel Correlation (CLPC)
E N D
Presentation Transcript
Cross-lagged Panel Correlation (CLPC) David A. Kenny
Example • Depression and Marital Satisfaction measured at two points in time. • Four measured variables S1, S2, D1, and D2.
Causal Assumptions • Most analyses of longitudinal variables explain the correlation between two variables as being due to the variables causing each other: S D and D S. • CLPC starts by assuming that the correlation between variables is not due to the two variables causing one another. • Rather it is assumed that some unknown third variable, e.g., social desirability, brings out about the relationship.
Model of Spuriousness • Assume that a variable Z explains the correlation between variables at each time. The variable Z is changing over-time. • The model is under-identified as a whole, but the squared correlation between Z1 and Z2 is identified as rD1S2rD2S1 /(rD1S1rD2S2).
Ruling out Spuriousness • The strategy developed by Kenny in the 1970s in a series of paper is to assume stationarity. • Requires at least three variables measured at each time. • Stationarity • Define how much variance for a given a given variable, say D, is available to correlate. • Define the ratio of variance, time 2 divided by time 1.
Stationarity • Define how much variance for a given a given variable, say XA, is available to correlate. • Define the ratio of variance, time 2 divided by time 1 for XA, to be denoted as kA2. • Given stationarity, the covariance between XA and XB at time 2 equals the time 1 covariance times kAkB. • Also C(XA1,XB2)kB = C(XA2,XB1)kA where C is a covariance.
Basic Strategy • Test for stationarity of cross-sectional relationships. • df = n(n – 3)/2 • If met, test for spuriousness. • df = n(n – 1)/2 • Mplus syntax can be downloaded at www.handbookofsem.com/files/ch09/index.html
Example Data Dumenci, L., & Windle, M. (1996). Multivariate Behavioral Research, 31, 313-330. Depression with four indicators (CESD) PA: Positive Affect (lack thereof) DA: Depressive Affect SO: Somatic Symptoms IN: Interpersonal Issues Four times separated by 6 months Use waves 1 and 2 for the example 433 adolescent females Age 16.2 at wave 1
Example • Test for stationarity of cross-sectional relationships: • c2(2) = 5.186, p = .075 • Because stationarity is met, test for spuriousness: • c2(6) = 2.534, p = .865 • Evidence consistent with spuriousness. • Mplus syntax can be downloaded at • www.handbookofsem.com/files/ch09/index.html
Why is this strategy not adopted? • Most researchers are interested in estimating a causal effect, not in showing you do not need to estimate any causal effects. • Also, CLPC was initially proposed as way of determining causal effects, not as a way of testing of spuriousness.
In principle… • Researchers should show that spuriousness can plausibly explain the covariation in their data. • CLPC has a use.