Download
1 / 24
250 likes | 356 Vues
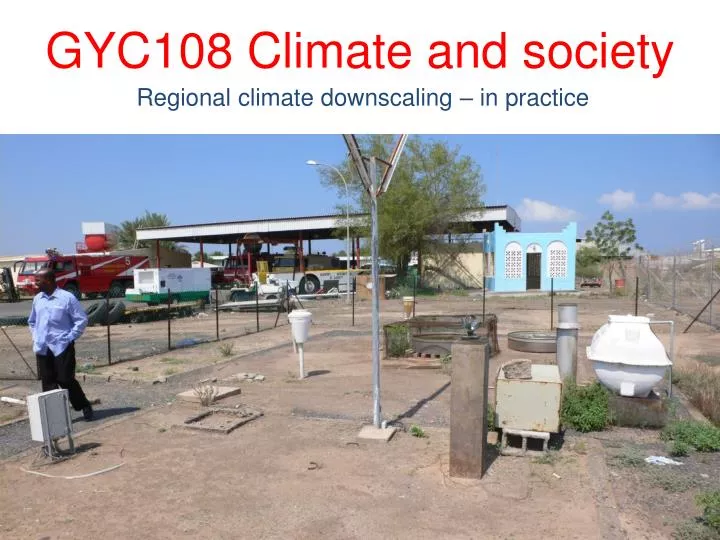
GYC108 Climate and society. Regional climate downscaling – in practice. Choice of GCM(s): affects all downscaled scenarios.

E N D
GYC108 Climate and society Regional climate downscaling – in practice
Choice of GCM(s): affects all downscaled scenarios Projected changes in annual rainfall (PRCP) and maximum temperature (TMAX) in Djibouti by the 2050s downscaled from seven GCMs under SRES A2 emissions. Data source: Climate Systems Analysis Group, University of Cape Town
Comparable skill of statistical and dynamical methods Correlation of modelled and observed precipitation indices for each season for SEE. Bars show inter-quartile range and median with 5th and 95th percentiles indicated by outer range. Source: Haylock et al. (2006)
Choice of downscaling method determines local scenario Projected changes in spring precipitation totals for the 2080s for two downscaling methods (UCT, SDSM) and three climate models (CSIRO, ECHAM4, HadCM3) under SRES A2 emissions. Source: Wilby & DMN (2007)
Predictability varies in space and time Variations in the strength of the correlation between daily wet–day amounts at Eskdalemuir (55º N, 3º W) and mean sea level pressure (MSLP), and near surface specific humidity (QSUR) over the Scottish Borders region, 1961–1990.
Choice of predictor variable domain Frequency and location of predictors selected for downscaling daily precipitation occurrence (top) and amounts (bottom) at selected sites across Iberia (crosses)
Choice of predictor variable suite Site-specific optimum predictor sets for Northern Ireland when using the Republic of Ireland grid boxes. Site pie chart segment size reflects the ranked order of explained variance provided by each of the 5 optimum predictors. Source: Crawford et al. (2007)
Low skill at heavy summer rainfall Percent difference (discrepancy) between grid cells for UKMO and control simulations for the 1-day 5-year return value during summer. Most of the RCMs underestimate the precipitation extremes. Source: Fowler and Ekstrom (2009)
Extrapolating beyond the calibration data Downscaling daily wind gust (m/s) for Singapore under present (top) and future (lower) climate conditions.
Findings from inter-comparison studies • GCM boundary conditions are the main source of uncertainty affecting all regional downscaling methods • Statistical and dynamical downscaling have similar skill • Different downscaling methods yield different scenarios • There are no universally “optimum” predictor(s)/domains • Downscaling extreme events is highly problematic (summer rainfall predictability is very low) • Skilful downscaling of present climate does not imply skilful downscaling of future scenarios of change
When is statistical downscaling problematic? Photo: http://www.flickr.com Photo: Bull (1929) Photo: Richenda Connell
Data sparse where needed most The global network of the World Weather Watch (WWW) stations colour coded to indicate silence (red dot) or reporting rates in 2008. Source: WMO (2009)
Local forcing: Cooling by late season snow cover 1982/83 El Nino Observed and downscaled seasonal mean TAVG at Niwot Ridge, Colorado
Simpler methods may suffice Sensitivity of annual mean total chlorophyll-a concentration (mg m-3) to changing water temperature (C) and nutrient load: (a) Changing nitrate and soluble reactive phosphorous (SRP); (b) Changing SRP. Source: Elliott & May (2008)
Simpler methods may suffice 90th percentile daily precipitation (mm/d) in autumn (SON) for OBS (top left), for direct output from the reanalysis (ERA40), for the local intensity scaling (LOCI-E40), and for three regional climate models (CHRM, HADRM, HIRHAM). Results are valid for the period 1979-1993. Source: Schmidli et al. (2006)
Guidance for downscaling in practice IPCC (2007) UNDP (2006)
Public domain downscaling tools SDSM UCT ENSEMBLES
Application: daily precipitation (for ski resorts) Downscaled and observed daily precipitation for a site above 3000 m in the US Rockies
Application: high resolution seasonal forecasts Forecast of June-July-August rainfall anomalies (% normal) based on SSTs in April 2009, downscaled from ECHAM4.5 by RSM Source: FUNCEME http://www.funceme.br/DEMET/index.htm
Application: seasonal streamflow forecasts West-wide seasonal hydrologic forecast system. Source: http://www.hydro.washington.edu/forecast/westwide/sflow/index.cpc.6mons.shtml#seas_vol
Application: intensity of London’s urban heat island Statistically downscaled nocturnal temperature gradient between central and outer London for the present and 2050s. Source: Wilby (2008)
Utility of downscaling when there is no consensus amongst GCMs? Source: IPCC AR4 (2007)
Utility of higher resolution with uncertainty? 2050s A1FI 90th percentile 2050s B1 10th percentile Changes in wettest day in summer by 2050s. Source: UKCP09
To what extent is downscaling science really entering adaptation practice? Number of ISBN research publications listed on the Web of Science. [Accessed May 2009]