Download
1 / 24
420 likes | 1.66k Vues
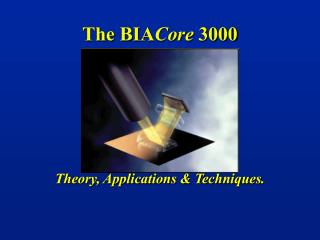
Characterisation of Molecular Interactions Using Surface Plasmon Resonance: BIAcore. Centre for Structural Biology Department of Life Sciences. Nathan Scott Wednesday 21 st May Technique Workshop: Protein-Ligand Interactions. Overview. Scope of the technique Principle of SPR Application

E N D
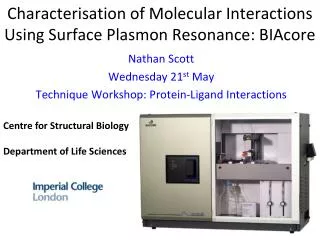
Characterisation of Molecular Interactions Using Surface Plasmon Resonance: BIAcore Centre for Structural Biology Department of Life Sciences Nathan Scott Wednesday 21st May Technique Workshop: Protein-Ligand Interactions
Overview • Scope of the technique • Principle of SPR • Application • Advantages and Limitations
Molecular Interactions Cell Adhesion Signal Transduction Antibody Binding Interactomics Endogenous Receptor-Ligand Interactions DNA Binding Proteins Drug – Target Interactions
What can be studied? Carbohydrates Whole Cells Proteins Scope of Technique Viruses Bacteria Nucleic Acids Small-Molecule Drugs Lipids & membrane molecules
Biomolecular Interaction Analysis: BIAcore • Detection principle: Surface Plasmon Resonance: SPR • One binding partner (LIGAND) immobilised on chip • Other (ANALYTE) injected: microfluidics • PC collects binding data in real time • Chip is regenerated to remove analyte • Cycle is repeated
Comprehensive information • Molecular interactions in real time: Detect Identify Characterize Yes/No Specificity Binding partners Affinity Kinetics Epitope mapping Concentration Thermodynamics Mass Spec Link-Up
Versatility • Range of chip surfaces • Range of coupling chemistries for different needs
Surface Plasmon Resonance • Critical angle of polarised light total internal reflection • Results in excitation of surface plasmons in the gold • Creates evanescent wave field dissipates into sample matrix • Intensity of reflected light depletes • Critical angle changes with changes in sample matrix (binding) • Change in angle is converted to resonance signal directly proportional to mass bound at surface
Kinetics provides unique information • Two molecules with identical affinity • Kinetic profiling differs significantly • Cannot be seen with end-point assays • Physiological relevance
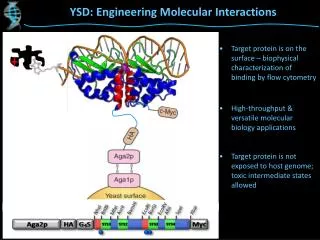
Antibody Engineering VL VH Molecular Engineering Single-Chain Fv • Retains monovalent binding affinity • Improved biodistribution/tissue penetration • Can be manipulated significantly • Can be selected from combinatorial libraries
FLOW 100mM Sodium Phosphate + 300mM NaCl + Surfactant p20 (0.005%) + Azide (0.005%) pH 7.4 Tox Tox Tox Tox Tox Tox Tox Tox Tox Tox Tox Tox Tox Tox Tox Tox Tox Tox Tox Tox Tox Tox Tox Tox Tox Tox Tox Tox Tox Tox Tox Tox Tox Tox Tox Tox Tox Tox Tox Tox Tox Tox Tox B B B B B B B B B B B B B B B B B B B B B B B B B B B B B B B B B B B B B B B B B B B Streptavidin Carboxymethylated dextran Gold surface Streptavidin Chip Platform (SA) Optical Interface Assay 10mM Glycine-HCl (pH 2.5)
Kinetics Experiment 70 Response (RU) 0 150 550 Time (s)
Results Model: Langmuir 1:1
Express & Purify Your Ligand/Analyte Label if necessary Check binding by ELISA* Dialyse/exchange into appropriate buffer What buffers are both your analyte & ligand stable in? Running buffer should contain a surfactant LOW Immobilise ligand on chip - Be careful!! Immobilisation buffer may be different From running buffer Optimise buffer and amount of ligand Kinetics Studies Determine optimal regeneration buffer Dissociate your ligand/analyte without damaging or removing ligand Concentration Determination Specificity Equilibrium Studies HIGH Kinetics Experiment!! So you want to play on the BIAcore…
Advantages • Once optimised – quick and rich data acquisition • Sensitive – (pM concentrations and low dalton MW) • Can re-use chip surface up to 100 times • Can write programs and set-up wizards • Can link up to mass spec • Low amounts of analyte/ligand required
Limitations • Mass transport limitations • Can take time to optimise regeneration conditions • Sorting problems can be time consuming
Contacts and Booking • Dr Lisa Jennings: Application Specialist GE Healthcare • E-mail: lisa.j.jennings@ge.com • Book the BIAcore at: www3.imperial.ac.uk/cmmi/core • Training strongly advised before using machine Onsite (Discounted): • Contact Prof. Kurt Drickamer; E-mail: k.drickamer@imperial.ac.uk • Will be a waiting time until enough people for course to take place Externally (Cambridge): • Book at www.biacore.com
Acknowledgements • Wellcome Trust • Dr Mahendra Deonarain • All the R.A.T lab members! • Dr Lisa Jennings