CONFOUNDING
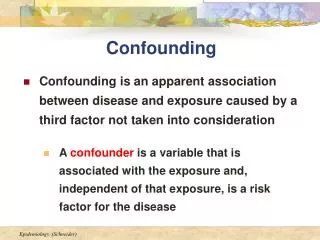
CONFOUNDING. DEFINITION: A third variable (not the exposure or outcome variable of interest) that distorts the observed relationship between the exposure and outcome. • Confounding is a confusion of effects that is a nuisance and should be controlled for if possible.


CONFOUNDING
E N D
Presentation Transcript
CONFOUNDING DEFINITION: A third variable (not the exposure or outcome variable of interest) that distorts the observed relationship between the exposure and outcome. • Confounding is a confusion of effects that is a nuisance and should be controlled for if possible. • Age is a very common source of confounding.
CONFOUNDING CRITERIA FOR A CONFOUNDING FACTOR: 1. Must be a risk factor (or protective factor) for the disease of interest. 2. Must be associated with the exposure of interest (e.g. unevenly distributed between the exposure groups). 3. Must not be an intermediate step in the causal pathway between the exposure and outcome
CONFOUNDING E D Confounding IS present CF Confounding NOT present E ?CF D
CONFOUNDING Hypothetical probability of Down’s syndrome Birth Order of Child What factor might confound the association between birth order and Down’s syndrome?
CONFOUNDING Hypothetical probability of Down’s syndrome Birth Order of Child Mean Age of Mothers Age1 < Age2 < Age3 < Age4 < Age5
CONFOUNDING Hypothesis:High alcohol consumption is associated with stomach cancer (case-control study) OR = (62 / 68) / (35 / 95) OR = 2.47 •The odds of being exposed to high alcohol consumption appear to 2.47 times higher for stomach cancer cases as compared to controls •The risk of stomach cancer is estimated to be 2.47 times higher in persons with high alcohol consumption as compared to persons without high alcohol consumption
CONFOUNDING But what about smoking? Perhaps the cases were more likely to be smokers than the control subjects since heavy consumers of alcohol may also be likely to be smokers. In other words, maybe high alcohol consumption has little to do with the risk of stomach cancer independent of smoking.
CONFOUNDING NON-SMOKERS SMOKERS OR = ????? OR = ????? Is there evidence that smoking confounds the relationship between alcohol consumption and stomach cancer?
CONFOUNDING NON-SMOKERS SMOKERS OR = (18 / 42) / (20 / 80) OR = (44 / 26) / (15 / 15) OR = 1.71 OR = 1.69 Is there evidence that smoking confounds the relationship between alcohol consumption and stomach cancer?
CONFOUNDING CRUDE ORCA = 2.47 STRATA 1 ORNS = 1.71 STRATA 2 ORSM = 1.69 In general: If Strata 1 OR < Crude OR > Strata 2 OR or If Strata 1 OR > Crude OR < Strata 2 OR then confounding is present.
CONFOUNDING CRUDE ORCA = 2.47 STRATA 1 ORNS = 1.71 STRATA 2 ORSM = 1.69 A more direct way to evaluate confounding is to aggregate the strata-specific point estimates to obtain a standardized (adjusted) estimate (Unit #6)
Confounding by Indication ● Often occurs in “pharmaco-epidemiology.” When evaluating the effect of a particular drug, many times people who take the drug differ from those who do not according to the medical indication for which the drug is prescribed. This means there may be differences in disease severity or other risk factors between the study groups, introducing a bias known as “confounding by indication.”
CONFOUNDING Hypothesis:Caffeine intake is associated with heart disease Which of the following are likely to be confounding factors?
CONFOUNDING Hypothesis:Caffeine intake is associated with heart disease Which of the following are likely to be confounding factors?
Evaluating Associations In summary, to declare with confidence that a “valid” statistical association exists: * Chance must be considered to be an unlikely explanation for the findings * Sources of bias have been considered and ruled out (or taken into account) * Confounding has been evaluated and ruled out (or taken into account)
Evaluating Associations Note: Keep in mind that even if chance, bias, and confounding have been sufficiently ruled out (or taken into account), it does not necessarily mean that the valid association observed is causal. The observed association may simply be a coincidence. (i.e. In the last 10, years, incidence rates for prostate cancer have increased, as have sales of SUVs and plasma TV screens).
Evaluating Associations A “valid” statistical association implies “Internal Validity” Internal Validity: The results of an observation are correct for the particular group being studied What about “external validity”? Do the results of the study apply (“generalize”) to people who were not in it (e.g. the target population)?
Evaluating Associations External Validity (Generalizability) * Some valid associations exist only within particular subgroups * Internal validity mustalways be the primary objective since an invalid result cannot be generalized * Thus, internal validity should never be compromised in an attempt to achieve generalizability
Evaluating Causal Associations CAUSATION:A philosophical concept merged with practical guidelines * The presence of a valid statistical association does not imply causality * A judgment of causality must be made in the presence of all available information, and reevaluated with each new finding * Different criteria and philosophical views have been proposed to assess causality
Evaluating Causal Associations The spectrum of the causal proposition: credibility 0 <-------------------------------------------------------> 100% 0 - 30 credibility: worthy of research study 30 - 70 credibility worthy of public health policy 70 - 90 credibility: almost an established fact > 90 credibility: proven fact Smoking --> lung cancer: 98% credibility
Evaluating Causal Associations Sufficient Cause: A set of minimal conditions that inevitably produce disease Component Cause: An individual cause of disease present within one or more sufficient causes Sufficient Cause II Sufficient Cause III Sufficient Cause I U U U A B A E B E
Sufficient Cause II Sufficient Cause III Sufficient Cause I U U U A B A E B E * Factor (cause) U is a “necessary” cause since it must be present for disease to occur * Individually, neither factors A, B, or E are “necessary” causes since disease can occur without any one of them. * UAB, UAE, and UBE are “sufficient” causes
EXAMPLE: Sufficient Cause III Sufficient Cause II Sufficient Cause I U U U A B A E B E Accounts for 50% of dx cases Accounts for 30% of dx cases Accounts for 20% of dx cases If we can prevent any of the factors: U = 100% reduction in disease occurrence A = 80% reduction in disease occurrence B = 70% reduction in disease occurrence E = 50% reduction in disease occurrence
EXAMPLE: Sufficient Cause III Sufficient Cause II Sufficient Cause I U U U A B A E B E Accounts for 50% of dx cases Accounts for 30% of dx cases Accounts for 20% of dx cases Hypothetical Example: U = Genotype susceptible ( “necessary”) to the disease A = Exposure to infectious agent B = Other chronic condition E = Psychological status
Sufficient Cause III Sufficient Cause II Sufficient Cause I U U U A B A E B E For biologic effects, most and sometimes all of the components of a sufficient cause are unknown In our ignorance of these hidden causal components,we classify people according to measured causal risk indicators, and then assign the average risk observed within a class to persons within the class
DIFFERENT PHILOSOPHIES OF CAUSAL INFERENCE * CONSENSUS: (Thomas Kuhn - 1962) The consensus of the scientific community determines what is considered accepted and what is refuted. * FALSIFICATION: (Karl Popper - 1959) Scientific hypotheses can never be proved or established as true. Therefore, science advances by a process of elimination (falsification) * INDUCTIVE-ORIENTED CRITERIA (Hill - 1965) Employ a common set of criteria to attempt to distinguish causal from non-causal associations
HILL’S CAUSAL CRITERIA 1. Strength of the association: Pro: The stronger the association, the less likely the relationship is due merely to some unsuspected or uncontrolled confounding variable Con: Strong but non-causal associations are common Example: Non-causal relation between Down syndrome and birth rank, which is confounded by maternal age Con: Ratio measures (e.g. RR) may be comparatively small for common exposures and diseases (e.g. smoking and cardiovascular disease)
HILL’S CAUSAL CRITERIA 2. Biologic credibility of the hypothesis: Pro: A known or postulated biologic mechanism by which the exposure might reasonably alter the risk of developing the disease is intuitively appealing Con: Plausibility is often based on prior beliefs rather than logic or actual data Con: What is considered biologically plausible at any given time depends on the current state of knowledge
HILL’S CAUSAL CRITERIA 3. Consistency of the findings Pro: Due to the “inexact” nature of epidemiologic investigations, evidence of causality is persuasive when several studies conducted by different investigators at different times yield similar results Con: Some effects are produced by their causes only under unusual circumstances Con: Studies of the same phenomenon can be expected to yield different results simply because they differ intheir methods and from random errors.
HILL’S CAUSAL CRITERIA 4. Temporal Sequence Pro: By definition, a cause of disease must precede onset of the disease. Con: The existence of an appropriate time sequence can be difficult to establish (e.g. lifestyle factors are likely to be altered after the first symptoms of a disease occur). Confounding by indication may also occur for transient exposures.
HILL’S CAUSAL CRITERIA 5. Dose-Response Relationship Pro: Logically, most harmful exposures could be expected to increase the risk of disease in a gradient fashion (e.g. if a little is bad, a lot should be worse) Con: Some associations show a single jump (threshold) rather than a monotonic trend Con: Some associations show a “U” or “J” shaped trend (e.g. alcohol consumption and mortality)
SUMMARY OF EVALUATING CAUSALITY Multiple philosophies exist for evaluating causality. None are definitive. The set of causal criteria offered by Hill are useful, but are also saddled with reservations and exceptions. Always keep an open mind when evaluating evidence from epidemiologic studies.
SUMMARY OF EVALUATING CAUSALITY Medewar (1979) “I cannot give any scientist of any age better advice than this: the intensity of the conviction that a hypothesis is true has no bearing on whether or not it is true.”