Download
1 / 48
480 likes | 621 Vues
Precipitation Uncertainty due to Variations in Particle Parameters within a Simple Microphysics Scheme. Dr. Matt Gilmore DAS/UIUC. Presented 10 Dec 2007. (Photo Credit: NCAR/NSF). Collaborators. Jerry Straka - OU School of Meteorology Erik Rasmussen - OU/NSSL Special Thanks to

E N D
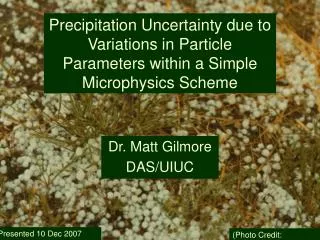
Precipitation Uncertainty due to Variations in Particle Parameters within a Simple Microphysics Scheme Dr. Matt Gilmore DAS/UIUC Presented 10 Dec 2007 (Photo Credit: NCAR/NSF)
Collaborators • Jerry Straka - OU School of Meteorology • Erik Rasmussen - OU/NSSL Special Thanks to Bob Wilhelmson, Adam Houston, Leigh Orf, Ted Mansell, Lou Wicker Sue van den Heever
Purpose • Test precip. sensitivity to hail, snow, and rain particle characteristics in a single-moment bulk ice microphysics package (used in WRF) • Can we trust precipitation forecasts from such models? Tornado forecasts? • Motivate the use of more sophisticated microphysics
National Hail Research Experiment1972-1974, 1976, Grover, CO • Examined the influence of cloud seeding on hailfall (Photo Credit: NCAR/NSF) (Photo Credit: NCAR/NSF) Former division that worked on NHRE became MMM.
Prediction of Precipitating Weather Systems - Cloud Microphysics and Precipitation “... the specific sources of error must be identified in current microphysical parameterizations, and physically based improvements to the model physics must be developed, particularly for ice formation...” (MMM/NCAR Science Plan, Oct. 2000) The Costner’s, April 1975 (Photo Credit: NCAR/NSF)
Top-5 Severe Weather Hazards that Caused Crop and Property Damage (1995 - 2000) 27% Total=$11.2 Billion 25% $3.0 per Year $2.0 11% 9% 8% $1.0 $0.0 l t e d o i h a n o d g H a o a u l c n F i o r r r o r D u T H Average Cost Per Year (Billions of U.S. dollars) (NWS Natural Hazard Statistics)
Hail Vulnerability • Tobacco, tea, and soybeans -> numerous 5 mm hail,(Changnon 1971, 1977, 1999) • Other crops, farm animals, & property -> larger hail (Largest from supercells; Changnon 2001) • Could we someday forecast hail occurrence & its characteristics? (Photo Credit: NCAR/NSF)
Supercell Flooding Potential • Hypothesized that supercells might contribute to climatology of extreme rainfall (100-year recurrence interval). (Smith et al. 2001, J. Hydrometeor.) e.g., dense gauge network, max rainfall rates: Orlando, FL: 330 mm h–1 (26 Mar. 1992) Dallas, TX: 231 mm h–1 (5-6 May 1995) Would cloud model flooding predictions help?
Hail Climatology # Hail Days/year (1901-1994) Mean Hail Diameter (cm) Changnon (1996) Changnon and Changnon (1999)
Hail Forecasting • Climatology • Synoptic Pattern Based • See review articles by Longley and Thompson (1965); Johns and Doswell (1992). • Sounding Based • Edwards and Thompson (1998) demonstrated thermodynamic parameters to be practically useless in hail severity forecasting: VIL, CAPE, maximum parcel level, EL, convective cloud depth, wet-bulb zero, freezing level. Suggested that forecasts of storm rotation be made. Progress? • Reliable NWP cloud model forecasts? (We show …not yet)
Numerical Experiments • Straka Atmospheric 3-D Cloud Model (SAM). Similar to the N-COMMAS model. • 6th order Crowley advection on scalars. 2nd order flux scheme on momentum. • Prognostic equations for u, v, w, q, p, TKE, qv, qc, qr. Optional ice physics.
Model Set-up • 91x91x22 km domain • dx,dy = 1000 m, dz = 500 m • 1°C perturbation bubble. • Horizontally homogeneous environment
Experimental Design • Idealized environments from Weisman and Klemp (1984). CAPE= 2200 J kg-1 T , Td Profile Hodographs
Experimental Design • Microphysics scheme: • Three-class bulk ice scheme (ice, snow, and hail/ graupel). [Lin et al. (1983), “LFO”] Includes warm rain scheme for cloud and rain. Referred to herein as “3-ICE” • Scheme described in Gilmore et al. (2004; MWR, August issue) • Similar schemes still being used (Purdue-Lin and WSM-6)
“3-ICE” Process Rates • 6 species • Single moment
Many Limitations • Species are constrained to a predefined distribution function which experiences bulk/average fallout. • Scheme doesn’t predict number concentration or other moments. • Inconsistencies in diameter’s used for different processes (see McFarquhar & Black 2004; Potter 1991) • Efficiencies are assumed constant.
Limitations (continued) • Only a single graupel/hail (qh) species. • Pick parameters such as the particle intercepts, densities, and fall velocity coefficients a priori (There are many more “gotchas”… but we will focus on the two above)
Knight et al. (1982) .12 Relative Frequency .06 104 106 108 Intercept (dm-3 mm-1 ) NHRE-Motivated Sensitivity Testing
Density (kg m-3) Hail: 700 to 900 Graupel: 50 to 890 Hail: 400 Reference Pruppacher and Klett (1978) D. Zrnić, personal communication Particle Density Observations
Standard LFO params no Species Size Distributions
Species Fallspeeds • Larger and more dense fall faster
3x 4x
N3r9 Peas Dimes Golfballs
Peas Dimes
Midlevel Storm Structure and Surface Gust Front Evolution t=30 t=60 t=90 t=120
Midlevel Storm Structure and Surface Gust Front Evolution Warmer! t=30 t=60 t=90 t=120
Getting microphysics “right” is important for simulating the right downdraft Z ~ 500 m Z = 0 m
Low-level Storm Structure and Surface Gust Front t=60 min (Us=50)
Temporally and Horizontally-Averaged Vertical Profiles
Temporally and Horizontally-Averaged Vertical Profiles (cont’d)
Thus, N8r4 case has larger mass of qh but spread over larger area Smaller fall velocities
Second Sensitivity Test • When the intercepts for the following species were increased individually by 2 orders of magnitude, then total precipitation fall decreased by... • Rain (N6 to N8): 3 Tg • Snow (N5 to N7): 4 Tg • Large Ice (N4 to N6): 12 Tg • Greatest sensitivity to qh
Third Sensitivity Test • Change the ground-relative (GR) motion but not the vertical wind shear... • Result: point rainfall and hailfall doubles although total system mass preserved New GR-Motion: subtract 10 m s–1 from u windspeeds
Results Summary • Mass fallout changes by a factor of 4 when the “large ice” distribution is varied within its observational limits. Weaker shear shows differences of a factor of 3. Us=20 m/s cases (not shown) had factor of 2. • Thus, sensitive to the vertical wind shear • Model precipitation is more sensitive to changes in the “large ice” distribution than the snow or rain distribution. • Precipitation depth is also a function of GR-storm motion.
Conclusion • While simple bulk microphysics schemes such as LFO can be “tuned” and may have value in a research mode, they are probably not well suited for precipitation forecasts.
Future Work: Improved schemes Multiple Moments for 3 or 4 ice categories • e.g., Ferrier (1994), Siefert and Beheng (2001) More ice categories (necessary - McCumber et al.) More liquid and ice categories, more moments, particle density prediction, Straka and Gilmore (2008)
Two Moment, 5-ice, 3-rain scheme • Straka and Gilmore (2008) • Will this reduce the precipitation uncertainty?
Joe and Jill Newham, April 1975 Thanks for your attention! (Photo Credit: NCAR/NSF)
Supplemental Figures Rates t = 30 min
Supplemental Figures Rates t = 90 min
Light Rain Moderate Rain Heavy Rain Large Drops Rain/Hail Graupel/Small Hail Hail Dry Snow Wet Snow Horizontal Ice Vertical Ice Conventional versus Dual-Polarization Radar Conventional Radar Reflectivity Hydrometeor Classification Cimmaron, OK, az=148.2°, 2316 UTC 6 June 1996. (Adapted from Zrnic et al. 2001).