Download
1 / 1
10 likes | 129 Vues
Explore precision ionospheric radio sounding methods based on phase principles. Learn how phase ionosondes provide unique products for Space Weather-related applications, such as 3D plasma density inversion and small-scale irregularity diagnostics.

E N D
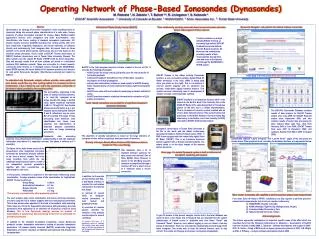
Operating Network of Phase-Based Ionosondes (Dynasondes) M. Rietveld 1, N. Zabotin 2, T. Bullett 2,3, R. Livingston 4, S. Kolesnik 5 1 EISCAT Scientific Association , 2 University of Colorado at Boulder, 3 NOAA/NGDC, 4 Scion Associates Inc., 5 Tomsk State University Abstract Dynasonde is an ideology of precision ionospheric radio sounding based on rigorously taking into account phase characteristics of a radio echo. Unique products of phase ionosondes intended for various Space Weather-related applications include: echo recognition and noise discrimination, echo classification into traces, scaling of standard ionospheric parameters, 3-D plasma density inversion (NeXtYZ) including true vertical profile with error bars, small-scale irregularity diagnostics, and vector velocities, all obtained directly and autonomously from ionogram data. At present there are three systems in the world which operate continuously and are fully based on the precision phase principles. These reside at EISCAT Tromsø observatory, at EISCAT Svalbard observatory, and at Tomsk State University (Russia). The latter system uses the newest HF Radar ("VIPIR") built by Scion Associates. Data and analysis results from all three stations are stored in a distributed relational SQL database network. These are accessible to a broad research community either directly or, in abridged version, through the NOAA/NGDC-based SPIDR system. We report details of the network operation and describe its web portal Dynasonde Navigator (http://dynserv.eiscat.uit.no) hosted by EISCAT. Dynasonde Navigator: web portal for the network of phase ionosondes 3-Dimensional Plasma Density Inversion (NeXtYZ) Three continuously operating ionosondes based on precision phase principles form an initial segment of future network The three stations are at high-latitude (EISCAT Tromsø), at extremely high-latitude (EISCAT Svalbard) and at mid-latitude (Tomsk, Russia) locations. All three are now continuously providing results of their measurements through their own web sites on the Internet and through the NOAA/NGDC’s SPIDR system. • NeXtYZ is the first ionogram inversion scheme created in the era of PCs. It provides the following advantages: • NeXtYZ yields the actual vertical fp(h) profile, plus the vertical profile of horizontal gradients; • treatment of magnetic field effects is free of the biases caused by assumption of vertical propagation; • ordinary and extraordinary echoes are used equally in NeXtYZ allowing better characterization of under-represented (valley, night E) ionospheric regions; • NeXtYZ uses state-of-the-art models for underlying ionization and the E-F valley; • NeXtYZ provides extensive statistical information for estimation of fp(h) profile uncertainties. EISCAT Tromsø is the oldest existing Dynasonde location. A very successful partially digital NOAA HF Radar developed in the early 1980’s is being used there (see photo on the right). This is a 6-antenna 2-receiver system supplied with an advanced log-periodic vertex-down zigzag transmit antenna. This system has been extensively used in development of modern versions of all Dynasonde methods. Home page of the web portal (http://dynserv.eiscat.uit.no). To understand why Dynasonde analysis software provides more quality and more diverse results than any other existing method, it is necessary to look at fundamentals: at how it treats the raw I and Q data (quadrature components of the received signal) provided by the sounding system. The old tradition, originating in the years of analog sounding systems, is to treat the ionogram as an image. Usually this image is plotted using signal amplitude expressed in dB: A = 10·log(I2+Q2). Very limited phase-based information (e.g, a pol-arization tag to distinguish between O and X reflections) may be used. But all essential first steps of data processing (echo detection, echo classification into traces, trace selection, and determination of important physical parameters) were done as image processing procedures. EISCAT Svalbard is an ionosonde location which is the closest to the Earth’s North Pole. Basically this is the NOAA HF Radar of the same design that in Tromsø (see photos on the left), but in a mobile implementation. This is a 4-antenna 2-receiver system supplied with an inverse delta transmit antenna. This system had served previously at the British Antarctic Survey’s Halley Bay observatory in Antarctica, and it was recently (in 2008) relocated to EISCAT Svalbard observatory. Vector velocity calculations are provided for all significant ionospheric structures individually: The EISCAT’s Dynasonde Database contains results of data analysis for EISCAT Tromsø station since June 2009, for EISCAT Svalbard station since September 2009, and also contains results of earlier data processing for three stations (Bear Lake Obs., Utah from February 2003 to June 2006, EISCAT Tromsø from June 2003 to December 2006, and Lycksele, Sweden from March 2004 to August 2005). Ionospheric observatory of Tomsk State University is the 5th in the world and the oldest continuously operating ionospheric facility in Russia (since 1936). In 2009 it was equipped with the newest fully digital Scion HF Radar ("VIPIR"). This is an 8-antenna 8-receiver system supplied with a rhombic transmit antenna. The radar’s photo is on the right, images of the antenna system are below. The algorithm of velocity calculations is based on the large statistics of ionogram echoes, without requiring a dedicated mode of operation. Dynasonde data processing primarily uses phase-based information, complementing it with the amplitude information only where it is especially relevant. The phase is defined as P = atan2(Q,I). Dynamically updated “Latest Ionogram” and “Last 48 Hours” pages of the web portal are shown above. Other graphical tools, including the database interface, are represented below. Diversity of Analysis Results Makes Relational SQL Database a Natural Solution for Their Local Storage The figure on the right shows results of the phase-based echo recognition procedure performed by dynasonde analysis software in the “time of arrival” domain. This is the same recording from which the raw amplitude image was used above. A total of six independent physical parameters, together with their uncertainties, are determined for each echo. SQL databases have a lot of standard software solutions for data access and retrieval. One of them, MySQL Query Browser, is shown on the left. Many research tasks are accomplished through a common API and a direct access to a database using a secure connection. Home page of a modern Dynasonde system is itself an instrument of ionospheric monitoring and research • In this process, ionospheric roughness is the main factor influencing actual uncertainties. Average practical values of the uncertainties for high-latitude EISCAT Tromsø location are: • Group Range ± 100 m • Horizontal echolocations ± 1 km • Doppler Velocity ± 3 m/s • Polarization ± 1 deg • This accuracy is unmatched by other processing methods. In addition, for those who are not familiar with SQL, a web-based interface is provided for each station connected to the Internet that allows a) retrieval of several kinds of ionogram-related information, in both textual and graphical formats; b) execution of complex queries intended for selection of the analysis results subject to several conditions. An example data query: A 7-month-long series of eastward drift velocity values when zenith angle of the Sun was between 45 and 50 degrees and foE was less than 2 MHz. Other modern ionosondes with capability to perform precision phase-based measurements The next analysis steps (echo classification into traces and trace selection), are done using the list of echoes supplied with accurate physical parameters. This is also an innovative approach in the field of ionospheric radio sounding. These steps are critical for dependable autonomous data processing. Accurate parameters allow application of an extended set of physical criteria to avoid blunders. This is how Dynasonde ideology resolves the problem of dependability of autonomous data processing at the level not achievable for preceding techniques. In addition to the standard ionospheric parameters, unique Dynasonde products include: dependable autonomous scaling of standard ionospheric parameters, 3-D plasma density inversion (NeXtYZ), small-scale irregularity diagnostics, and vector velocities, all obtained autonomously and directly from ionogram data. • Four other Scion HF Radar ("VIPIR") installations are fully capable to perform precision phase-based measurements, but do not yet operate continuously: • NOAA/NGDC, Boulder, Colorado, • NASA’s Wallops Flight Facility, Wallops Island, Virginia, • Jicamarca Radio Observatory, Peru, • National Central University, Taiwan. To get full access to the present analysis results and to the local database one needs to have a User Name and a Password that are obtained from the system administrator. A limited access is attainable with User Name "Guest" and Password "Guest". However, even without logging in one can obtain a few key pieces of information. There is a reduced-size automatically renewed image of the latest ionogram. One needs only to keep the Internet browser open to stay current. The scripts on this page are browser- and system-independent. Acknowledgements The authors appreciate contributions to important specific areas of the effort which are described here from the following collaborators: G. Zhbankov – development of NeXtYZ inversion routines in 2002-2009; L. Zabotina – software development and support in 2003-2010; A. Senior – fixing of BPG mode on legacy dynasonde systems in 2009; J.W. Wright and M.L.V. Pitteway – analysis software development before 2006.