Download
1 / 45
450 likes | 597 Vues
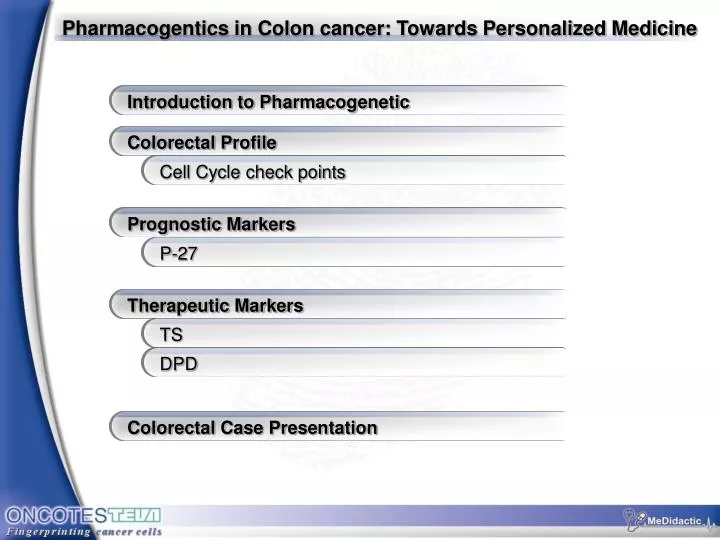
Pharmacogentics in Colon cancer: Towards Personalized Medicine. Introduction to Pharmacogenetic. Colorectal Profile. Cell Cycle check points. Prognostic Markers. P-27. Therapeutic Markers. TS. DPD. Colorectal Case Presentation. Pharmacogenetics. Disease. Pharmacogenetics. Disease.

E N D
Pharmacogentics in Colon cancer: Towards Personalized Medicine Introduction to Pharmacogenetic Colorectal Profile Cell Cycle check points Prognostic Markers P-27 Therapeutic Markers TS DPD Colorectal Case Presentation
Pharmacogenetics Disease
Pharmacogenetics Disease Phenotype
Pharmacogenetics Environment Genotype Phenotype
Pharmacogenetics Environment Genotype Phenotype Genetic / Pathologic Predisposition Natural History Genetic / Therapeutic Predisposition Reaction to Therapy
Pharmacogenetics Environment Genotype Phenotype Genetic / Pathologic Predisposition Natural History Prognosis, Therapy benefits Genetic / Therapeutic Predisposition Reaction to Therapy
G1 S M G2 Colorectal profile Cell Cycle - Checkpoints G0 Gap 1 - S phase Preparations DNA duplication Mitosis Gap 2 - mitosis Preparations “Loss of these checkpoints, would have disastrous implications by leading to a variety of genetic abnormalities, is commonplace in cancer cells.” De Vita et al. CANCER; 6th ed. 2001.
G0 G1 Colorectal profile Cell Cycle - G1 to S transition R "The length of the G1 phase is dependent on extra cellular signals and may be coupled to a cell's growth in size. The ability to arrest in G0 phase of the cell cycle is fundamentally abnormal in cancer cells." De Vita et al. CANCER; 6th ed. 2001.
G0 G1 Colorectal profile Cell Cycle - G1 to S transition R RB "RB was the first tumor suppressor identified that directly functioned to block cell proliferation. RB: 1. Forced expression caused cells to arrest in G1. 2. Inactivation allowed cell-cycle progression into S phase. 3. Naturally occurring mutations in the RB gene rendered the protein unable to stop cell proliferation." De Vita et al. CANCER; 6th ed. 2001.
G0 G1 Colorectal profile Cell Cycle - G1 to S transition R RB E2F-1 E2F-1: 1. Founding member of a family of at least 6 transcription factors. 2. Activates expression of genes encoding transcription factors that are induced as cells enter S phase or proteins involved in DNA synthesis. De Vita et al. CANCER; 6th ed. 2001.
G0 G1 Colorectal profile Cell Cycle - G1 to S transition R RB E2F-1 Cyclin D1, D2, D3, E + cdk Cyclins (D - Type & E): Expressed maximally as cells progress from G1 into S phase. Cyclins (A & B): Expressed in other cell cycle phases. All form complexes with the cyclin-dependent kinase (cdk), phosphorylating the RB protein. De Vita et al. CANCER; 6th ed. 2001.
G0 G1 Colorectal profile Cell Cycle - G1 to S transition R "…their activity is regulated at numerous levels… …by interactions between cdks or cyclin/cdk complexes and other proteins known as cyclin/cdk inhibitors (CKIs - p21WAF1/CIP1, p27KIP1, and p57KIP2). RB E2F-1 Cyclin D1, D2, D3, E + cdk CKIs De Vita et al. CANCER; 6th ed. 2001.
G0 G1 Colorectal profile Cell Cycle - G1 to S transition R RB E2F-1 Cyclin D1, D2, D3, E + cdk p53 The tumor suppressor gene, p53, is a critical component, arresting cells in G1 after DNA damage. It is mutated in a large proportion of human cancers. CKIs De Vita et al. CANCER; 6th ed. 2001.
S Colorectal profile Cell Cycle - S phaes "The task of generating and regulating the process of making an exact copy DNA is quite daunting. pre-RC DNA synthesis begins at defined sequences referred to as replicator elements. The multiple proteins that form a DNA-binding complex to generate these footprints are known as the origin of replication complex (ORC). post-RC The pre-replication ORC (pre-RC) is assembled and competent to begin replication in G1 phase, but is held in check by some mechanism to prevent the formal initiation of DNA synthesis. The post-RC represents a complex that is competent to carry out DNA synthesis from the origin of replication to which it is bound. De Vita et al. CANCER; 6th ed. 2001.
G2 Colorectal profile Cell Cycle - M phase entry and exit Cyclin B/cdk1 cdc25 chk1 "Once the cell has copied the entire genome, it enters a second gap phase, known as G2, to prepare for entry into mitosis. DNA damage-induced arrest of cells in the G2 phase of the cell cycle is prominent in most mammalian cell types. DNA damage activates a kinase known as chk1, which can phosphorylate cdc25, the phosphatase that is critical for activating cyclin B/cdk1 at entry into mitosis. De Vita et al. CANCER; 6th ed. 2001.
M Colorectal profile Cell Cycle - M phase entry and exit Errors in this process are irreversible and lead to dramatic alterations in the genetic material. The first regulatory mechanism for mitosis involved the Maturation / Mitosis Promoting Factor (MPF), characterized as a complex of cyclin B and cdk1. Cyclin B/cdk1 is the most crucial step governing whether a cell enters mitosis. Cyclin B + cdk1 De Vita et al. CANCER; 6th ed. 2001.
Colorectal profile – P27 (kip1) Cyclin/cdk inhibitors (CKIs) “CKIs have grown in importance and in number since they were first described. Thus far, two groups of CKIs have been identified. One group includes p21WAF1/CIP1, p27KIP1, and p57KIP2, which appear to be universal inhibitors of cyclin/cdk activity… In principle, any cdk inhibitor might act as a tumor suppressor protein. ” De Vita et al. CANCER; 6th ed. 2001.
Colorectal profile – P27 (kip1) Prognostic Significance of P27(kip1) Expression in Colorectal Cancer: a Clinico-pathological Characterization. Background: The G1 – S transition in the cell cycle is controlled by protein complexes composed of cycline and cycline dependent kinases (CDKs). The activity of cycline – CDK complex is affected by two families of CDK inhibitors (CDIs) – the INK4 group (P15, P16, P16, P19) and the CIP/KIP group (P21, P27, P57). P27 induces cell cycle arrest in response to extra cellular anti-proliferative signals. Patients: 89 patients with primary colorectal cancers. Intervention: IHS evaluation of cyclin-dependent kinase inhibitor p27(Kip1) expression. Primary Endpoint: To assess p27(Kip1) expression, and to relate p27 levels to clinico-pathological characteristics, tumor cell proliferation, and the expression of other G1-S transition regulatory proteins. Palmqvist R. et al. J Pathol 1999;188(1):18-23.
50 40 30 % patients 20 10 0 Colorectal profile – P27 (kip1) Prognostic Significance of P27(kip1) Expression in Colorectal Cancer: a Clinico-pathological Characterization. Results: P27 expression (by labeling index) 46% 33% “Interestingly, tumors expressing low or very low p27 LIs were predominantly found in the right colon (p = 0.026).” 11% 10% + ++ +++ ++++ Palmqvist R. et al. J Pathol 1999;188(1):18-23.
+ 100 ++ +++ 80 ++++ 60 % survival 40 20 0 0 10 20 30 40 50 60 70 80 90 100 Time (months) Colorectal profile – P27 (kip1) Prognostic Significance of P27(kip1) Expression in Colorectal Cancer: a Clinico-pathological Characterization. Results: Cancer specific survival (by labeling index) P = 0.036 Palmqvist R. et al. J Pathol 1999;188(1):18-23.
100 +, ++ ( < 50%) +++, ++++ ( > 50%) 80 60 % survival 40 20 0 0 10 20 30 40 50 60 70 80 90 100 Time (months) Colorectal profile – P27 (kip1) Prognostic Significance of P27(kip1) Expression in Colorectal Cancer: a Clinico-pathological Characterization. Results: Cancer specific survival (by labeling index cutoff of 50%) P = 0.007 Palmqvist R. et al. J Pathol 1999;188(1):18-23.
Colorectal profile – P27 (kip1) Prognostic Significance of P27(kip1) Expression in Colorectal Cancer: a Clinico-pathological Characterization. Conclusions: “These findings support the view that p27 not merely controls cell cycle progression, but might be associated with other mechanisms responsible for aggressive tumor behavior in colorectal cancer.” “These findings support the view that p27 not merely controls cell cycle progression, but might be associated with other mechanisms responsible for aggressive tumor behavior in colorectal cancer.” Palmqvist R. et al. J Pathol 1999;188(1):18-23.
Colorectal profile - TS 5-Fluoropyrimidines DPD • Developed in the 1950’s. • 3rd most prescribed chemotherapy agent. • Single agent activity in colorectal ca. • Used in combination for breast cancer. • Analogues in development. 5-FU DHFU (80%) TP DPD FUDR 5-FU DHFU TK FdUMP
dUMP TMP TTP DNA Colorectal profile - TS 5-Fluoropyrimidines DPD • “Thymidylate Synthase (TS) catalyzes the sole intracellular de - novo formation of thymidine-5'-monophosphate. 5-FU • Alterations in the target enzyme TS represent the most commonly described mechanism of resistance to 5-FU. DHFU (80%) TP DPD FUDR 5-FU DHFU TK TS FdUMP
dUMP TS TMP TTP DNA Colorectal profile - TS 5-Fluoropyrimidines DPD • “Thymidylate Synthase (TS) catalyzes the sole intracellular de - novo formation of thymidine-5'-monophosphate. 5-FU • Alterations in the target enzyme TS represent the most commonly described mechanism of resistance to 5-FU. DHFU (80%) • Alterations in the target enzyme TS represent the most commonly described mechanism of resistance to 5-FU.” TP DPD FUDR 5-FU DHFU TK TS FdUMP FdUMP TMP TTP DNA
High extracellular DPD Too low extracellular DPD High intracellular DPD Low intracellular DPD High intracellular TP Low intracellular TP High intracellular TK Low intracellular TK High intracellular TS Low intracellular TS dUMP TS TMP TTP DNA Colorectal profile - TS 5-Fluoropyrimidines DPD 5-FU DHFU (80%) TP DPD FUDR 5-FU DHFU TK TS FdUMP FdUMP TMP TTP DNA
Colorectal profile - TS TS Expression: an Independent Prognostic Factor for Local Recurrence, Distant Metastasis, Disease-free and Overall Survival in Rectal Cancer. Background: Several studies have suggested that the intratumoral level of thymidylate synthase (TS) in colorectal tumors correlates with survival. Patients: 243 patients who had undergone primary surgery for rectal cancer. Intervention: TS enzyme levels were evaluated by IHC using the specific monoclonal Ab. TS 106 in paraffin-embedded tumors. Primary Endpoint: To study the correlation between TS expression in primary rectal cancer and locoregional recurrence, distant metastases, and survival. Edler D. et al. Clin Cancer Res 2000 ;6(4):1378-84.
100 80 Low TS High TS 60 DFS (%) 40 20 0 0 1 2 3 4 5 6 7 8 9 10 Years after surgery Colorectal profile - TS TS Expression: an Independent Prognostic Factor for Local Recurrence, Distant Metastasis, Disease-free and Overall Survival in Rectal Cancer. Results: Disease Free Survival by TS expression P < 0.001 Edler D. et al. Clin Cancer Res 2000 ;6(4):1378-84.
100 80 Low TS High TS 60 40 20 0 0 1 2 3 4 5 6 7 8 9 10 Years after surgery Colorectal profile - TS TS Expression: an Independent Prognostic Factor for Local Recurrence, Distant Metastasis, Disease-free and Overall Survival in Rectal Cancer. Results: Overall Survival by TS expression Overall survival (%) P < 0.001 Edler D. et al. Clin Cancer Res 2000 ;6(4):1378-84.
0 1 2 3 4 5 6 Hazard Ratio Colorectal profile - TS TS Expression: an Independent Prognostic Factor for Local Recurrence, Distant Metastasis, Disease-free and Overall Survival in Rectal Cancer. Results: Relative hazard for recurrence, new tumor or death 1.0 Dukes' A, low TS 1.5 Dukes' A, high TS 1.7 Dukes' B, low TS 2.7 Dukes' B, high TS 3.3 Dukes' C, low TS 5.1 Dukes' C, high TS Edler D. et al. Clin Cancer Res 2000 ;6(4):1378-84.
Colorectal profile - TS TS Expression: an Independent Prognostic Factor for Local Recurrence, Distant Metastasis, Disease-free and Overall Survival in Rectal Cancer. Conclusions: “We concluded that the intratumoral expression of TS in primary rectal cancer is an independent prognostic factor for locoregional recurrence, distant metastases, DFS, and OS. Patients with low intratumoral TS expression had a significantly better outcome than those with high TS expression.” “Intratumoral expression of TS in primary rectal cancer is an independent prognostic factor for locoregional recurrence, distant metastases, DFS, and OS. Patients with low intra-tumoral TS expression had a significantly better outcome than those with high TS expression.” Edler D. et al. Clin Cancer Res 2000 ;6(4):1378-84.
Colorectal profile - TS TS gene polymorphism determines response and toxicity of 5-FU chemotherapy. Background: TS catalyses the conversion of deoxy-uridylate to deoxy-thymidylate and is essential for DNA synthesis. The human TS gene promoter is polymorphic, having either double or triple tandem repeats of a 28-bp sequence. Patients: 50 patients with disseminated colorectal cancer who received 5-FU treatment. Intervention: The TS mRNA level was analyzed using RT-PCR. Primary Endpoint: To determine the significance of TS polymorphism in humans and its prediction for clinical outcome of patients with metastatic colorectal cancer treated with 5-FU. Pullarkat S.T. et al. Pharmacogenomics J 2001;1(1):65-70.
50 40 30 % patients 20 10 0 Colorectal profile - TS TS gene polymorphism determines response and toxicity of 5-FU chemotherapy. Results: TS genotype in tumor tissue 50% TS mean = 5.53 P for trend = 0.011 29% TS mean = 9.42 21% TS mean = 2.60 L/L(Triple repeat homozygous) S/L(Triple repeat heterozygous) S/S(double repeat homozygous) Pullarkat S.T. et al. Pharmacogenomics J 2001;1(1):65-70.
50 40 30 % patients 20 10 0 Colorectal profile - TS TS gene polymorphism determines response and toxicity of 5-FU chemotherapy. Results: TS genotype and 5-FU respnse 50% P for trend = 0.041 15% 9% L/L(Triple repeat homozygous) S/L(Triple repeat heterozygous) S/S(double repeat homozygous) Pullarkat S.T. et al. Pharmacogenomics J 2001;1(1):65-70.
20 16 12 Months 8 4 0 Colorectal profile - TS TS gene polymorphism determines response and toxicity of 5-FU chemotherapy. Results: TS genotype and overall survival (months) P for trend = 0.37 16.2 8.5 8.3 L/L(Triple repeat homozygous) S/L(Triple repeat heterozygous) S/S(double repeat homozygous) Pullarkat S.T. et al. Pharmacogenomics J 2001;1(1):65-70.
Colorectal profile - TS TS gene polymorphism determines response and toxicity of 5-FU chemotherapy. Conclusions: “The data suggest that genotyping for the TS polymorphism may have the potential to identify patients more likely to respond to 5-FU based chemotherapy.” “The data suggest that genotyping for the TS polymorphism may have the potential to identify patients more likely to respond to 5-FU based chemotherapy.” Pullarkat S.T. et al. Pharmacogenomics J 2001;1(1):65-70.
Colorectal profile – DPD, TS, TP Colorectal Tumors Responding to 5-fluorouracil Have Low Gene Expression Levels of Dihydropyrimidine Dehydrogenase, Thymidylate Synthase, and Thymidine Phosphorylase. Background: high gene expressions (mRNA levels) of thymidylate synthase (TS) and thymidine phosphorylase (TP) in pretreatment tumor biopsies could identify tumors that would be non-responsive to 5-FU - based therapy. Patients: 33 untreated colorectal pt. who went on to receive treatment with 5-FU and leucovorin (LV). Intervention: Dihydropyrimidine Dehydrogenase (DPD) expressions were measured by quantitative RT-PCR. Primary Endpoint: we investigated the association between intra-tumoral gene expression of the pyrimidine catabolism enzyme DPD and the response of colorectal tumors to the same 5-FU-based protocol. Salonga D. et al. Clin Cancer Res 2000;6(4):1322-7.
18 16 14 12 10 Relative DPD gene expression (x10-3) 8 6 4 2 0 Colorectal profile – DPD, TS, TP Colorectal Tumors Responding to 5-fluorouracil Have Low Gene Expression Levels of Dihydropyrimidine Dehydrogenase, Thymidylate Synthase, and Thymidine Phosphorylase. Results: DPD gene expression according to tumor response (> 50% shrinkage) 100% P = 0.005 2.5 50% Response No response Salonga D. et al. Clin Cancer Res 2000;6(4):1322-7.
18 16 14 12 10 Relative DPD gene expression 8 6 4 2 0 0 5 10 15 20 Relative TS gene expression Colorectal profile – DPD, TS, TP Colorectal Tumors Responding to 5-fluorouracil Have Low Gene Expression Levels of Dihydropyrimidine Dehydrogenase, Thymidylate Synthase, and Thymidine Phosphorylase. Results: DPD expression plotted against TS expression Salonga D. et al. Clin Cancer Res 2000;6(4):1322-7.
18 Response No response 16 14 12 10 Relative DPD gene expression 8 6 4 2 0 0 5 10 15 20 Relative TS gene expression Colorectal profile – DPD, TS, TP Colorectal Tumors Responding to 5-fluorouracil Have Low Gene Expression Levels of Dihydropyrimidine Dehydrogenase, Thymidylate Synthase, and Thymidine Phosphorylase. Results: DPD expression plotted against TS expression 4.1 DPD < 2.5, TS < 4.1 and TP < 18 = 100% response DPD > 2.5, TS > 4.1 or TP > 18 = 0% response P = 0.0001 2.5 Salonga D. et al. Clin Cancer Res 2000;6(4):1322-7.
Colorectal profile – DPD, TS, TP Colorectal Tumors Responding to 5-fluorouracil Have Low Gene Expression Levels of Dihydropyrimidine Dehydrogenase, Thymidylate Synthase, and Thymidine Phosphorylase. Conclusions: “Intra-tumoral gene expression level of DPD is associated with tumor response to 5-FU and that the use of more than one independent determinant of response permits the identification of a high percentage of responding patients.” “Intra-tumoral gene expression level of DPD is associated with tumor response to 5-FU and the use of more than one independent determinant of response permits the identification of a high percentage of responding patients.” Salonga D. et al. Clin Cancer Res 2000;6(4):1322-7.
TS DPD - stained tumor area 0.18 Intermediate DPD - tumor intensity +3 +3 +1 Intermediate Intermediate Low +3 Intermediate DPD – stained stromal area DPD –stroma intensity Colorectal profile Case Study # 1 • 70 years old male • S/P. Left colectomy • Pathology: Moderately Differentiated Adeno Carcinoma • T = 5 3.5 cm • N = 1/12 • Tests results:
Clinical responseprobability Degree ofresistance Drug tested % rank Untreated Prior chemo. Interferon alfa Capecitabine Mitomycin C Fluorouracil Carmustine Oxaliplatin Irinotecan Cisplatin 25% 64% 88% 88% 71% 56% 88% 76% Intermediate Intermediate Intermediate Intermediate Extreme Extreme Extreme Low 12% 19% 28% 38% 3% 3% 3% 4% 23% 11% 17% 7% 2% 2% 3% 2% Colorectal profile Case Study # 1 • 70 years old male • S/P. Left colectomy • Pathology: Moderately Differentiated Adeno Carcinoma • T = 5 3.5 cm • N = 1/12 • Tests results:
Colorectal profile Case Study # 1 • 70 years old male • S/P. Left colectomy • Pathology: Moderately Differentiated Adeno Carcinoma • T = 5 3.5 cm • N = 1/12 • Tests results: • Treatment regimen = 5-FU, Irinotecan