Comprehensive Analysis of Student Performance: Summary and Improvement Strategies
150 likes | 270 Vues
This comprehensive report includes three key analyses of student performance: the Profile Summary Report, the Item Response Summary Report, and targeted improvement goals. The Profile Summary Report compares student performance against national norms, identifies subgroup performances by gender and ethnicity, and highlights the percentage of students needing assistance in key skill areas like writing and mathematics. The Item Response Summary Report provides detailed data on test scores and quartile distributions. Together, these reports aim to enhance understanding of student achievement and foster continuous improvement in academic outcomes.

Comprehensive Analysis of Student Performance: Summary and Improvement Strategies
E N D
Presentation Transcript
Three reports to analyze student performance 1. Profile Summary Report: Presentation Packet2. Item Response Summary Report3. Profile Summary Report
Profile Summary Report: Presentation Packet • Compares students with the national norm group
Profile Summary Report: Presentation Packet • Identify subgroup performance: gender and ethnicity
Profile Summary Report: Presentation Packet • Identifies the percent of students needing assistance in a skill or area (writing, mathematics, options after high school)
Profile Summary Report: Presentation Packet • Identifies student career preferences
Item Response Summary Report • Item response summary count for each subject test • English
Item Response Summary Report • Mathematics
Profile Summary Report • Identifies the mean for each subject test • Identifies the frequency of scores for each subject test • Identifies the percent of students in each subject test quartile
Profile Summary Report • Analyze quartile distribution
Profile Summary Report • Compare the percent of quartile distribution between the Explore and TerraNova for the same group of students Explore Class of 2013 (8th grade) English Math Reading Science Composite TerraNova Class of 2013 (7th grade)
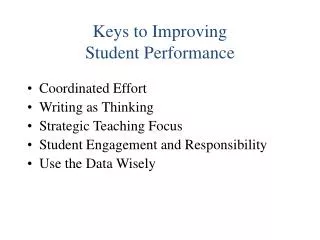
Continuous improvement process Schools gain a better understanding of their current reality Create improvement goals that targets academic achievement