Planning Mixed-Use Centers to Enhance Transportation Performance
260 likes | 382 Vues
This document discusses the creation of mixed-use centers around major transportation areas, primarily driven by improvements in transportation performance. The proposed plan includes a diverse range of centers—both regional and neighborhood-focused—strategically located around transit options for better access throughout the Vistas. Comparing two scenarios, it highlights Scenario S's emphasis on sustainable development and improved connectivity over Scenario X's more traditional land use approach, which lacks regional transit and places greater environmental strain.

Planning Mixed-Use Centers to Enhance Transportation Performance
E N D
Presentation Transcript
Scenario S:Creating Mixed-use Centers Around Major Transportation Areas Is The Primary Driver Of Improved Transportation Performance • Plan a range of mixed use centers around transit • A few regional centers • Many neighborhood centers • Close access to centers throughout the Vistas
Scenario S:Creating Mixed-use Centers Around Major Transportation Areas Is The Primary Driver Of Improved Transportation Performance • Plan a range of mixed use centers around transit • A few regional centers • Many neighborhood centers • Close access to centers throughout the Vistas
Scenario S:Creating Mixed-use Centers Around Major Transportation Areas Is The Primary Driver Of Improved Transportation Performance • Plan a range of mixed use centers around transit • A few regional centers • Many neighborhood centers • Close access to centers throughout the Vistas
Scenario S: Enhanced Network • 7 Bus corridors • Within ½ mile of transit: • 30% Households • 47% Jobs +28% +19%
Scenario X Land Use Parameters • Half the housing units and jobs of Scenario A • 202,500 Housing Units • 80% single family housing • Averaging about ~6 dwelling units per net acre (3-4 per gross), similar to single family prevalent in the Gold Canyon and San Tan Valley areas • 150,000 Jobs • Primarily strip commercial with some office • Retail and employment centers located at freeway and arterial intersections • Small amount of multi-family located around interchanges and employment centers • Less environmental sensitivity and open space • More encroachment into washes • Development on slopes • Fewer parks, more golf courses
Scenario X Transportation Parameters • No regional transit, limited local transit • Freeways built as planned • Highway 60 and 79 expanded to 6 lane expressways, but with surface intersections • Extension of existing major arterials • Follow conventional arterial pattern of one arterial per mile (use section lines)
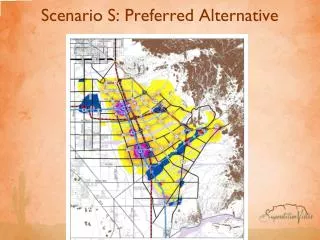
Comparing Scenario S and X Scenario S: Preferred Alternative Scenario X: Basecase
Transportation Emissions (CO2)Tons of CO2 per Year Per Capita
Housing Mix Comparison Scenario X continues current trends, Scenario S anticipates future demographic shifts and changing housing needs.
Building Emissions (CO2)Annual CO2 (ton/yr) Building emissions are lower in Scenario X because employment buildings use more energy
Building Emissions (CO2)Annual CO2 (ton/yr) Per Capita Building emissions are lower in Scenario X because employment buildings use more energy
Total Water Demand(Gallons/day - Building and Landscaping) Per Capita