Download

1 / 49
490 likes | 562 Vues
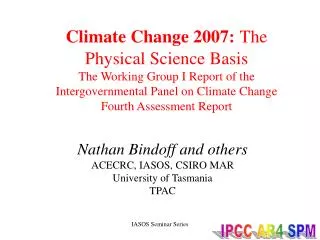
Climate Change 2007: The Physical Science Basis Chapter 5:Observations: Oceanic Climate Change and Sea Level The Working Group I Report of the Intergovernmental Panel on Climate Change Fourth Assessment Report. Nathan Bindoff and lead authors ACECRC, IASOS, CSIRO MAR University of Tasmania

E N D
Climate Change 2007: The Physical Science BasisChapter 5:Observations: Oceanic Climate Change and Sea LevelThe Working Group I Report of the Intergovernmental Panel on Climate Change Fourth Assessment Report Nathan Bindoff and lead authors ACECRC, IASOS, CSIRO MAR University of Tasmania TPAC
IPCC: team effort • Chapter 5 Team • Lead authors 11 • Review editors 2 • Contributing authors 52 • Four reviews • ~2000 comments • Every comment • has a response • ~6000 emails
Observations: Oceanic climate change and sea level • Global scale temperature and salinity change • Regional scale ocean changes • Ocean bio-geochemical change (ocean carbon cycle) • Changes in sea level • Synthesis “Warming of the climate system is unequivocal, as is now evident from observations of increases in global average air and ocean temperatures, widespread melting of snow and ice, and rising global average sea level (see Figure SPM-3).”
Vertical overturning ocean circulation Blue: Antarctic Green: North Atlantic Red : Southern Ocean Schmitz 1996
Heat content change: vertical distribution Linear trend 1955-2003
Global heat content change: spatial pattern Linear trend 1955-2003 • Warming not uniform • Equatorial Pacific cooling warming
Heat content change: time evolution • Key points for 1961-2003: • consistency of products • oceans absorbed 0.21 ± 0.04W m–2 (0-3000m) over the earth’s surface. • 70% of this energy is absorbed in top 700 m • 0.1°C warming (0-700m) • 1993-2003 has higher rates of warming (0.50 ± 0.18W m–2) • decadal variability, cooling since 2003
Earth’s overall energy balance • Key points: • > 80% of energy change is stored in the oceans • ice sheets, glaciers and ice caps about 1%energy • ice sheets, glaciers and ice caps about 40% sea level
Ocean climate change: salinity Atlantic Ocean Pacific Ocean
Ocean climate change: salinity Summary of salinity changes • Large-scale, coherent trends of salinity are observed for 1955–1998 • global freshening in subpolar latitudes • increasing salinity in shallower parts of the tropics and subtropics. • Freshening is pronounced in the Pacific while increasing salinities prevail over most of Atlantic and Indian Oceans. Relevant to the atmosphere and climate • These trends are consistent with changes in precipitation and inferred larger water transport in the atmosphere from low latitudes to high latitudes and from the Atlantic to the Pacific.
Observed change in overturning circulation? “…we assess that over that over the modern instrumental record no coherent evidence for a trend in the mean strength of the [Atlantic] MOC has been found.” • Based on: • 1970’s to 1990’s MOC increased by 10% (SST and models) • 1970’s to 1995 convection strong in Labrador sea • (increased MOC) but convection now weak ( decrease in MOC) • Denmark overflow mean strength unchanged (record to short) • Atlantic subpolar gyre (from direct measurements) • unchanged in strength • Hydrographic data at 25°N show a 30% decrease (1957-2004)
Ocean carbon cycle: surface pCO2, pH Increased pC02 implies decreased pH pH decreasing at a rate of 0.02 pH units per decade. 20 years
Ocean carbon cycle: vertical distribution Pacific and Indian Ocean • Anthropogenic carbon • Dissolved inorganic carbon • Chloroflourocarbons • Pre-industrial (~1750) • Estimate of added DIC • Water chemistry Atlantic Ocean
Ocean carbon cycle: spatial pattern Deep overturning Depth integrated Anthropogenic Carbon Subduction zone Upwelling Largest zone of carbon storage is in the Southern ocean.
Ocean carbon cycle: global uptake It is more likely than not that the fraction of all the emitted CO2 that was taken up by the oceans has decreased….. Implying reduced rates of renewal of key ocean water masses
Oxygen changes: North Pacific Ocean • There is evidence for decreased • oxygen concentrations, likely to be driven by reduced rates of water renewal in most ocean basins from the early 1970’s to the late 1990’s.
The sea level budget • The main contributions to sea level: • Slr = thermal exp. + • (glaciers + ice-caps) + Greenland + Antarctica • + ……. • Focus on two periods in the report: • 1961-2003 • 1993-2003
20th century sea level • Rates of sea level rise: • 1.8 ± 0.5 mm yr-1, 1961-2003 • 1.7 ± 0.5 mm yr-1, 20th Century • 3.1 ± 0.7 mm yr-1, 1993-2003 • Consistency of • sea level data • Variability of • sea level data • Are rates increasing?
Thermal expansion’s contribution to sea-level The. Exp. SLR Thermal expansion 1993-2003 Sea-level rise 1993-2003 • Sea level rise is spatially non-uniform • Thermal expansion controls spatial pattern • Observed thermal expansion 1.6 ± 0.5 mm yr-1, 1993-2003 • 0.4 ± 0.1 mm yr-1, 1961-2003
Glacier contribution to sea-level since 1961 Increased glacier retreat since the early nineties • Mass loss from glaciers and ice caps: • 0.5 ± 0.18 mm yr-1, 1961-2003 • 0.77 ± 0.22 mm yr-1, 1991-2003
Ice sheet contributions to sea level rise • Mass loss of Greenland: • 0.05 ± 0.12 mm yr-1 SLE, 1961-2003 • 0.21 ± 0.07 mm yr-1 SLE, 1991-2003 • Mass loss of Antarctica: • 0.14 ± 0.41 mm yr-1 SLE, 1961-2003 • 0.21 ± 0.35 mm yr-1 SLE, 1991-2003 Antarctic ice sheet loses mass mostly through increased glacier flow Greenland mass loss is increasing Loss: glacier discharge, melting
1961-2003: Sea level budget not quite closed. • 1993-2003:Sea level budget is closed. Accounting for observed sea level rise
3.1 mm yr-1 Tide-gauges 1.8 mm yr-1 Steric Sea-level Has the sea level rise rate increased? • The 1993-2003 has high rate of rise compared with the 1961-2003 period. • Other periods have had sea-level rise as high as 1993-2003 • On longer term (since 19th century) sea-level rise rate has increased “It is unknown whether the higher rate in 1993–2003 is due to decadal variability or an increase in the longer term trend.”
Synthesis • The patterns of observed changes in global ocean heat content and salinity, sea-level, thermal expansion, water mass evolution and bio-geochemical parameters described in this chapter are broadly consistent with the observed ocean surface changes and the known characteristics of the large-scale ocean circulation.
The IPCC is a “remarkable example” of mobilizing expert analysis to inform policymakers Jeffrey Sachs (Nature, 12 August 2004) IPCC: process The IPCC assessments are “dull as dishwater” Tim Flannery, The Weather Makers
Thermal expansion’s contribution to sea-level Thermal Expansion 1961-2003 • 1961-2003 0.4 ± 0.1 mm yr-1
Greenland and Antarctic ice sheets of are shrinking Greenland mass loss is increasing Loss: glacier discharge, melting • Mass loss of Greenland: • -0.07 to 0.17 mm yr-1 SLE, 1961-2003 • 0.14 to 0.28 mm yr-1 SLE, 1991-2004 Greenland gains mass in the interior, but loses more at the margins
Greenland and Antarctic ice sheets of are shrinking • Mass loss of Antarctica: • -0.28 to 0.55 mm yr-1 SLE, 1961-2003 • -0.14 to 0.55 mm yr-1 SLE, 1991-2004 Antarctic ice sheet loses mass mostly through increased glacier flow
Sea Level: progress since the TAR • In observations: • Mass balance of Antarctica • Mass balance of Greenland • Better records of glaciers • Extended records of global sea-level to 1870’s • New records of altimeter data • Different error analysis- combined in quadrature • Errors are quoted as 90% confidence intervals compared with 95% intervals in TAR • In interpretation: • Assessed errors in observations are now smaller relative to TAR • Largest uncertainties in thermal expansion (1993-2003), Antarctica, and sea level observations • Causes of difference between sea level and its contributions in long term records (1961-2003) is unresolved - either the observations or un-quantified processes. • Climate contributions to sea level can explain the observations in the short term (1993-2003)
Glacier contribution to sea-level since 1961 Increased glacier retreat since the early nineties • Mass loss from glaciers and ice caps: • 0.5 ± 0.18 mm yr-1, 1961-2003 • 0.77 ± 0.22 mm yr-1, 1991-2003
Ice sheet contributions to sea level rise • Mass loss of Greenland: • 0.05 ± 0.12 mm yr-1 SLE, 1961-2003 • 0.21 ± 0.07 mm yr-1 SLE, 1991-2003 • Mass loss of Antarctica: • 0.14 ± 0.41 mm yr-1 SLE, 1961-2003 • 0.21 ± 0.35 mm yr-1 SLE, 1991-2003 Antarctic ice sheet loses mass mostly through increased glacier flow Greenland mass loss is increasing Loss: glacier discharge, melting
Accounting for observed sea level rise • 1961-2003: Sea level budget not quite closed. • 1993-2003:Sea level budget is closed.