Download
1 / 27
270 likes | 512 Vues
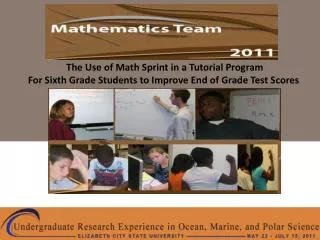
The Use of Math Sprint in a Tutorial Program For Sixth Grade Students to Improve End of Grade Test Scores. Mathematics Education Team . Ms. Dalesha Cartman JR-Math/ Math Ed. Mr. Sean Leavy JR-Math/ Math Ed. Mr. Marvin Elder II JR-Mathematics. Mr. Kaiem Frink Assistant Team Mentor.

E N D
The Use of Math Sprint in a Tutorial Program For Sixth Grade Students to Improve End of Grade Test Scores
Mathematics Education Team Ms. DaleshaCartman JR-Math/ Math Ed Mr. Sean Leavy JR-Math/ Math Ed Mr. Marvin Elder II JR-Mathematics Mr. KaiemFrink Assistant Team Mentor Dr. Darnell Johnson Team Mentor Mr. Brian Jordan Assistant Team Mentor
Abstract The Use of the Math Sprint in a Tutorial Program for Sixth Grade Students to Improve End of Grade Test Scores Key Words: Algebra, Combinatorial Mathematics, Tree Graphs, Estimation, Geometry, Probability, Statistics, Transformations What is the effect of a math sprint tutorial model on Mathematics achievement of sixth graders at Elizabeth City Middle School in Elizabeth City, North Carolina? A math sprint tutorial process was used during a three-week study with a group of 13 sixth-grade students to increase test scores from the previous 2011 Spring end of grade (EOG) test. The data, gathered from the post-test as a result of the series of tutoring sessions, was compared with the scores from the 2011 Spring EOG. Research studied the improvements made in scores on the North Carolina Mathematics state test.
Introduction • The North Carolina Mathematics Standard Course of Study provides a set of • Mathematical Competencies • Organization • Number and Operations • Measurement • Geometry • Data Analysis and Probability • Algebra
Elizabeth City Middle School "Home of the Mighty Yellow Jackets" 1066 Northside Road Elizabeth City, NC 27909 Mission: “ECMS”: Where Every Child Meets Success Theme: We are Family ECMS is a learning institution with highly skilled professionals who place our community children as our top priority. Our administration, classroom teachers, and support staff are committed to making sure that each student is provided with the best possible education because at ECMS: Every Child Meets Success Website: http://www.ecpps.k12.nc.us/ECMS/index.html
ECMS (cont) Performance School Term
Math Sprint Facilitator: Dr. Linda Hayden-ECSU Principles: Completing problems in a timed environment Receive points for correct answers Lose points for incorrect answers Motivator: Helps students develop better learning and cooperative skills
Pedagogy • Classroom Management- Teaching Philosophy • Assertive Discipline (Mr. Elder) • Preventative Discipline (Mr. Leavy) • Assertive and Preventative Discipline • (Ms. Cartman)
Bloom’s Taxonomy • Benjamin Bloom • Common Core • North Carolina Standards of Mathematics • Metacognitive Processes
Pedagogy Classroom Alignment The following is an example of the typical procedure followed for a tutoring session: (10 am- noon)
Observations • Problems • Background Knowledge • Classroom Challenges • Material • Attendance • Class Size
Math Sprint • Administration: 2 Sessions • 1: Week 2 • 2: Week 3 • Used to motivate students
Math Sprint: How It Works • Sense of TEAMWORK • through Competition • 3 Key Instructors • Score Keeper • Timer • Facilitator
Math Sprint - Implementation • Session 1 • Groups • Reward System • EOG questions • Session 2 • Groups • Reward System • EOG (short answer)
Data • Data that was analyzed: • 2011 Spring EOG Score • Diagnostic Exam Score (raw) • Released EOG Score (raw) • Diagnostic Exam: • Developed by the Math Education Team, modeled after EOG exam • 30 questions (20 calculator, 10 w/o calculator)
Data • Released EOG Exam: • Taken from the North Carolina Department of Education • Available Online (with full answer key) • 50 questions (36 calculator, 14 without calculator) • Spring EOG Exam: • Scaled scores received • Scores 342 – 350 (level 2)
Results-Diagnostic (6/14/11) Breakdown of performance of the 5 competencies 13 Students 10 Students Baseline for curriculum alignment
Results-Diagnostic Exam vs. EOG Exam Displays results of Diagnostic Exam compared to EOG Exam Diagnostic Exam EOG Exam
Results-Spring VS. Released EOG Baseline score of 342 (level 2) was assigned for the students’ Spring 2011 scores Spring Scores EOG Exam
Results-Spring VS. Released EOG Peak score of 350 (level 2) was assigned for the students’ Spring 2011 scores Spring Scores EOG Exam
Conclusion • Overall growth through weeks • Individual Scores • Attendance • Math Sprint
Future Work • A longer period of study (9 weeks) • Student Population Size (at least 20) • Requirement: Students’ EOG exam scores • Attendance • Keep “hands-on” approach with Math Sprint • Parent Participation
Acknowledgements We would like to thank: Mr. Brian Jordan- Data Analyst for the Office of Institutional Research for technical assistance (consultation). Mr. KaiemFrink- For his upkeep and safety of students’ records. Dr. Darnell Johnson- For affording the team with the guidance to conduct this research. Dr. Linda Hayden- Principal Investigator of the URE OMPS Summer Program at Elizabeth City State University. NOAA, NASA, CReSIS, CERSER, and ECSU- For their sponsorship.
References [1]Bransford, J., Brown, A., & Cocking, R. (Eds.) (1999). How people learn: Brain, mind, experience, and school. Washington, DC: National Academy Press. [2]Begle, E. (1979). Critical variables in mathematics education: Findings from a survey of empirical literature. Washington, DC: Mathematical Association of America. [3]Education Week. (1997). Quality counts: A report card on the condition of public education in the 50 states. A Supplement to Education Week, Vol. 16, January, 22. [4]Linn, R. L., Dunbar, S. B., Harnisch, D. L., & Hastings, C. N. (1982). The validity of the Title I evaluation and reporting system. In E. R. House, S. Mathison, J. Pearsol, & H. Preskill (Eds.), Evaluation Studies Review Annual (Vol. 7, pp. 427-442). Beverly Hills, Calif.: Sage Publications. [5]Linn, R. L., Graue, M. E., & Sanders, N. M. (1990). Comparing state and district results to national norms: The validity of the claims that “everyone is above average.” EducationalMeasurement: Issues and Practice, 9(3), 5-14. [6]Ma, L. (1999). Knowing and teaching elementary mathematics: Teachers' understanding of fundamental mathematics in China and the United States. Mahwah, NJ: Erlbaum. [7]Monk, D. A. (1994). Subject area preparation of secondary mathematics and science teachers and student achievement. Economics of Education Review, 13(2), 125-145. [8]Moore, D. S. & McCabe, G. (1999). Introduction to the practice of statistics. New York: Freeman. [9]Shaughnessy, M. (1992). Research in probability and statistics: Reflections and directions. In D. A. Grouws (Ed.), Handbook of research on mathematics teaching and learning (pp. 465-494). New York: Macmillan Publishing. [10]Shulman, L. S. (1986). Those who understand: Knowledge growth in teaching. Educational Researcher, 15(2), 4-14. [12]Siu, M. K. (1991). Concept of function---its history and teaching. In F. Swetz et al. (Eds), Learn from the masters (pp. 105-121). Washington, DC: Mathematical Association of America. [13]Springer, L., Stanne, M. E., & Donovan, S. S. (1999). Effects of small-group learning on undergraduates in science, mathematics, engineering, and technology: A meta-analysis. Review of Educational Research, 69(1), 21-51.