Minnesota Hospital Association
260 likes | 392 Vues
The Minnesota Hospital Association (MHA) presented initial findings from its Workforce Assessment Tool in 2008. This strategic tool aids member hospitals in managing workforce challenges, forecasting staffing needs, and improving advocacy efforts with real data. The assessment involved 37 organizations, representing over 51,600 employees, including various job titles within hospitals and clinics. The findings support long-term workforce planning and highlight the importance of understanding demographic trends and external labor market conditions, essential for proactive staffing and recruitment strategies.

Minnesota Hospital Association
E N D
Presentation Transcript
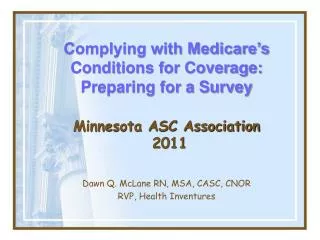
Minnesota Hospital Association MHA Workforce Assessment Tool: Initial Findings Presented By: Susan Klug
2008 MHA work force goal • Provide a tool for member hospitals: • To better manage work force and plan for the future • Benchmarking (state-wide, regional) • Forecast future staffing needs • Data from tool will improve advocacy efforts • Supported by real numbers • Legislators, educators, employers
Strategic work force planning • Long-term planning, not daily staffing tool • Industry-specific data (internal, external) • 2nd year of data collection • Build historical trends • Address work force needs of 88% of staffed hospital beds in MN
Summary of 2008 data • 37 Organizations • 51,663 employees (38,949 FTEs) • 161 total facilities reported • 71 Hospitals(38,765 employees, 28,869 FTEs) • 47 Clinics (9,229 employees, 7,314 FTEs) • 43 Other – LTC/nursing (3,669 employees, 2,766 FTEs) • Includes large and small organizations, both rural and urban • Additional organizations are expected to participate in 2009
Job Titles, RN • RN – Emergency Room • RN – Operating Room • RN – Labor & Delivery • RN – Medical – Surgical • RN – ICU • RN – Pediatrics • RN – Primary Care/Clinic • RN – Home Health • RN – Rehabilitation • RN – Behavioral (chemical dependency, mental health, eating disorders, addiction) • RN – Specialty (Bone marrow, wound care, vascular, diabetes, chronic care) • RN – Other • APRN (Midwives, CRNA, CNS)
Job Titles, all other • Lab Technician (2 yr. MLT) • Lab Technologist (4 & 5 yr. CLS/MT) • Imaging Tech (Radiology Tech, CT, MRI, other) • Imaging – Ultrasound • Speech Therapists • Occupational Therapists • Physical Therapists • Respiratory Therapists • LPN/Medical Assistant (includes both) • Pharmacist • Nursing Leadership (CNO, DON, Nurse Managers) • Physician Assistant • Nurse Practitioner • Physician – Primary Care • Physician – Specialty Care
Demographic attributes • Effective date • Employee ID • DOB • DOH • Gender • Ethnicity (EEOC guidelines) • Scheduled hours (80 hour pay period) • Hourly pay (base rate) • MHA member organization • Facility • Facility type • Your job type or position • MHA job type • Education level • Union/non-union • Hire type (new, experienced) • Staff type
The work force planning tool • Within the Workforce Planning Tool, the portal contains • three different sets of information: • The “Workforce Scan” evaluates PRESENT AND PAST. • It helps you understand and summarize the current state • of the workforce • The “Workforce Planning Model” projects the FUTURE • state of the workforce under a baseline and allows for • alternate forecasting assumptions • The “External labor Scan” summarizes key EXTERNAL • labor market variables •
Headcount summary – OR RNs • New hires in year – replacements and new add-ons: • 2009 = 145 • 2011 = 158 • 2013 = 170 • 2015 = 177 • 2017 = 188
Potential uses of tool output • Proactive staffing plans and execution • Forward planning for diversity recruitment • How business strategies impact talent strategies and vice versa • Work force plans relevant to needs of business • Identification of internal and external talent against business needs
Discussion questions • How do the findings impact you as an educator or employer? • What are other uses for the tool output? • What information, reporting or other data would be most helpful? • What other questions need to be answered? • What do you perceive to be next steps? • Retention, development, sourcing, educating
Contact information Susan Klug MHA Workforce Development 2550 University Ave. W., Suite 350-S St. Paul, MN 55114-1900 Phone 651.659.1424 sklug@mnhospitals.org