Download

1 / 41
410 likes | 548 Vues
Delta Smelt. Managing juvenile entrainment. The “so what” question. Relationship between STN and FMWT is tenuous Within limits, juvenile popn may not be important to adult popn Therefore, within limits, juvenile entrainment may not be important to adult popn. Conclusion.

E N D
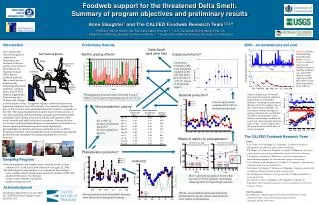
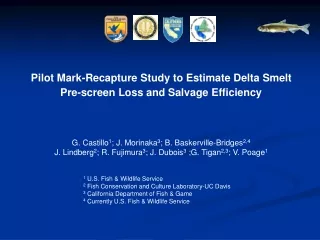
Delta Smelt Managing juvenile entrainment
The “so what” question • Relationship between STN and FMWT is tenuous • Within limits, juvenile popn may not be important to adult popn • Therefore, within limits, juvenile entrainment may not be important to adult popn
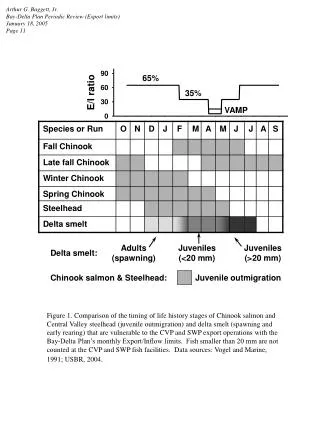
Conclusion • Salvage occurring after most smelt had left the SE Delta • High exports were sometimes occurring when significant fraction of smelt in SE Delta (& smelt < 20 mm) • Salvage a poor basis for measuring entrainment and managing exports
Better methodestimate % juveniles entrained • Estimate fraction of hatched popn at each 20 mm station • Use Particle Tracking Model to extimate chance of being entrained from each station • Sum results from all surveys
Delta schematic 10% of smelt 0% chance 50% of smelt 10% chance 40% of smelt 50% chance 50%*10% = 5% 10%*0% = 0% 40%*50% = 20% total = 25% Estimating % entrained without knowing population knowing distribution (based on cpue from 20 mm survey) knowing population Use relative cpue (or weighted cpue) to estimate % smelt at each station.Use PTM to estimate chance of entrainment in 14 days Estimate popn at each station Use part. track. model to estimate chance of entrainment in 14 days Delta schematic 100 smelt 0% chance 500 smelt 10% chance 400 smelt 50% chance 500*10% = 50 100*0% = 0 400*50% = 200 total = 250 250/1000 = 25% Conclusion: with an estimate of the %-age of smelt at each Station and PTM results, can estimate % entrained. Do not need an estimate of the population
Example of PTM results
Estimating annual juvenile entrainment from estimates for each survey • Must account for possibility that only a fraction have hatched in early surveys • Must account for fact that each survey’s percentage entrainment is only occurring to population not entrained in previous surveys (i.e., can’t double count)
Estimating fraction hatched for each survey • Various methods • Bennett’s otolith-age birthdating • 20 mm survey, presence of 5-6 mm smelt • Dates when water temp reaches 15 and 20 degrees • Bennett’s otolith birthdating • indicates that cumulative percentage hatched is approx. straight line relationship with time(?) • Combined data: 15-20 deg. reasonable, conservative = 10 days earlier
Cumulative entrainment is not 50% + 50% +40% = 140% It is only 85% ((100-15)/100 3rd survey 50% entrained 4th survey 50% entrained 5th survey 40% entrained
Managing exports to limit juvenile entrainment • Choose target % juvenile entrainment • Compute target % entrainment per survey • Predict % SE Delta from mid-March-mid-Apr Delta outflow • Use relationship of % entrain vs. (% SE Delta)*(exports surveys 1-5) to choose exports • Adjust exports to manage each survey’s % entrainment
Relative gear efficiency20 mm survey • Assume a relative efficiency curve • Smooth, no discontinuities • Very inefficient at 5 mm • Relative efficiency = 1.0 at 20 mm • Efficiency at 60 mm <1.0 • Adjust histograms using that curve • Find curve that causes decrease in all successive populations after all smelt have hatched
Test: For all “normal” surveys after hatching complete, each survey’s population should be less than previous survey’s