Download
1 / 1
10 likes | 115 Vues
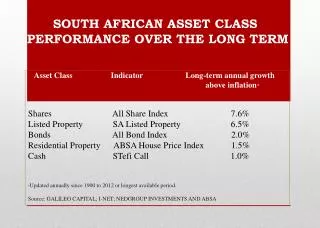
This report analyzes the long-term annual growth rates of various South African asset classes, revealing their performance above inflation. The key findings show that the Shares All Share Index leads with a growth of 7.6%, followed by Listed Property at 6.5%. Bonds exhibit a more modest growth of 2.0%, while Residential Property, as indicated by the ABSA House Price Index, reflects an increase of 1.5%. Cash investments, measured by the STEFI Call rate, show the least growth at 1.0%. The data has been updated annually from 1900 to 2012 or the longest available period.

E N D
SOUTH AFRICAN ASSET CLASS PERFORMANCE OVER THE LONG TERM Asset Class Indicator Long-term annual growth above inflation* Shares All Share Index 7.6% Listed Property SA Listed Property 6.5% Bonds All Bond Index 2.0% Residential Property ABSA House Price Index 1.5% Cash STefi Call 1.0% *Updated annually since 1900 to 2012 or longest available period. Source: GALILEO CAPITAL; I-NET; NEDGROUP INVESTMENTS AND ABSA