Download
1 / 10
100 likes | 305 Vues
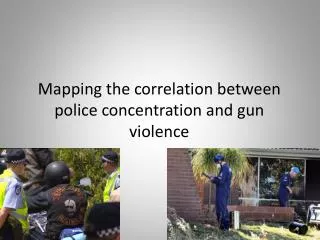
Mapping the correlation between police concentration and gun violence. Data visualizations . Choropleth map Dot density map . The creation of our visualization. Concentration of local area commands. Shooting clusters. Bibliography. http://www.police.nsw.gov.au/news/police_strength_figures

E N D
Mapping the correlation between police concentration and gun violence
Data visualizations Choropleth map Dot density map
The creation of our visualization Concentration of local area commands Shooting clusters
Bibliography http://www.police.nsw.gov.au/news/police_strength_figures http://www.dailytelegraph.com.au/news/sydney-news/gun-violence-plagues-sydneys-streets/story-fn7y9brv-1226333898332 http://www.guardian.co.uk/news/datablog/2012/mar/28/data-visualisation-tools-free http://www.netmagazine.com/features/15-fantastic-data-visualisations http://en.wikipedia.org/wiki/Choropleth_map http://blogs.esri.com/esri/arcgis/2008/04/18/dot-maps-vs-choropleth-maps-with-random-dot-area-symbols/