Download
1 / 37
370 likes | 376 Vues
This presentation discusses the challenges to conventional notions of governance and corruption, exploring topics such as national governance, corporate responsibility, control of terrorism, and the role of data in the governance field.

E N D
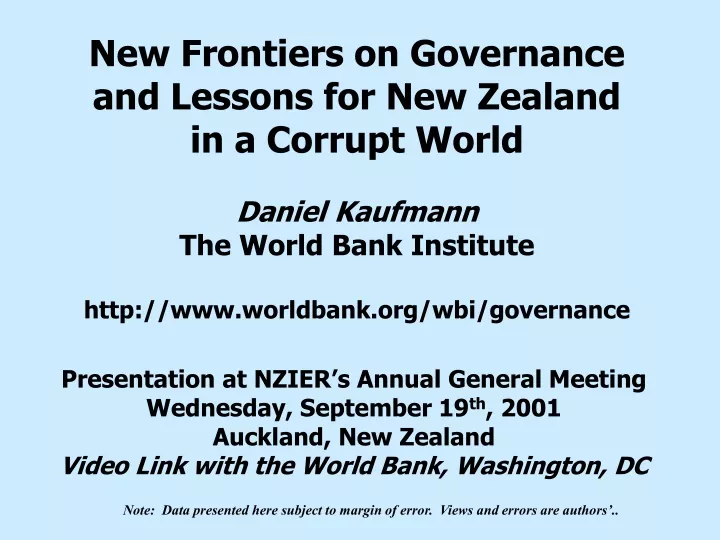
New Frontiers on Governance and Lessons for New Zealand in a Corrupt WorldDaniel KaufmannThe World Bank Institutehttp://www.worldbank.org/wbi/governance Presentation at NZIER’s Annual General Meeting Wednesday, September 19th, 2001 Auckland, New Zealand Video Link with the World Bank, Washington, DC Note: Data presented here subject to margin of error. Views and errors are authors’..
On Governance and Corruption: challenging eight conventions • Corporate Governance = National Governance? • National (Public) Governance = Control of Corruption? • Corporate Responsibility unrelated to Public Governance? • Control of Terrorism unrelated to control of corruption? • Unavailability/Unreliability of Data in governance field? • Administrative/Bureaucratic Bribery is key problem? • Corporate Strategies => improved National Governance? • NZ exporters/FDI can do little in a corrupt world? The 8 conventions above will be answered in the Negative.
What is Governance?:A working definition for public governance • Governance is the process and institutions by which authority in a country is exercised: (1) the process by which governments are selected, held accountable, monitored, and replaced; (2) the capacity of governments to manage resources efficiently, and to formulate, implement, and enforce sound policies and regulations; and, (3) the respect for the institutions that govern economic and social interactions among them
Operationalizing Governance:Unbundling its Definition into Components that can bemeasured, analyzed, and worked on Each of the 3 main components of Governance Definition is unbundled into 2 subcomponents: • Voice and Accountability • Political Stability and lack of Violence • Quality Regulatory Framework • Government Effectiveness • Control of Corruption • Rule of Law
Control of Corruption: Aggregate Indicator (selected countries from 155 worldwide, for illustration, based on 1998 research data*) Good Corruption Control Margin of Error Corruption Level POOR GOOD Source: ‘Governance Matters’, PRWP 2196 by Kaufmann, Kraay and Zoido. http://www.worldbank.org/wbi/governance/
Application of Rule of Law Varies by Region (based on aggregation of surveys/polls 1997-99*) High Index of Rule of Law Appli- cation Low Index OECD East Middle South Eastern Latin Sub- Former Asia East Asia Europe America Saharan Soviet Africa Union Note: Regional Averages shown for discussion purposes, and hide large intra-regional variation in each case. Thin vertical line reflects estimated margin of error. Source: Kaufmann, Kraay and Zoido-Lobaton (1999). "Aggregating Governance Indicators" and "Governance Matters" PWRP 2195 and 2196. http://www.worldbank.org/wbi/governance
Per Capita Income and Infant Mortality and Corruption Regulatory Burden 12,000 90 80 10,000 70 8,000 60 50 6,000 40 4,000 30 20 2,000 10 0 0 Weak Average Good Weak Average Good Development Regulatory Burden Control of Corruption Development x x Dividend Dividend Literacy and Rule of Law Per Capita Income and Voice and Accountability 100 10000 9000 8000 75 7000 6000 50 5000 4000 3000 25 2000 1000 0 0 Weak Average Good Weak Average Strong Development Development Rule of Law x x Voice and Accountability Dividend Dividend The ‘Dividend’ of Good Governance Note : The bars depict the simple correlation between good governance and development outcomes. The line depicts the predicted value when taking into account the causality effects (“Development Dividend”) from improved governance to better development outcomes. For data and methodological details visit http://www.worldbank.org/wbi/governance.
Probability of Losing Investment Due to Corruption(For FDI, within a 5-year period. Source SP/DRI, 2000, Selected Countries, Preliminary) [%] Certain Probability of Losing FDI due to Corruption Unlikely
Corruption in the Banking Sector, abridged(Source: EIU, 2001) Systemic corruption Honest Banking
Corruption/Absence of Rule of Law & Civil Liberties High Corruption [and Absence of Rule of Law] Low Not Free Partly Free Free Civil Liberties Based on averages of data from 160 countries.
Control of Graft and Freedom of the Press High Control of Graft [kkz] r = .68 Low Low High Freedom of the Press (Freedom House)
Diagnostic Surveys as Input to Action Program Design and Strategy: Illustrations 1. In-depth Country Diagnostic surveys of Firms, Users and Public Officials: identify misgovernance, corruption and institutional vulnerabilities in each agency 2. How costly is corruption in afflicted agencies? 3. How to Prioritize and design politically feasible reforms? Support Strategies? 4. Capacity Building and Institutional Development
Which Public Sector Jobs Are “Sold”? 60 Customs inspectors 48 41 52 Tax inspectors 41 25 39 Judges 32 16 Albania 25 Ordinary police 40 23 Georgia 32 Investigators/ prosecutors Latvia 33 14 5 Ministers 10 19 0 20 40 60 80 Percent of public officials reporting “purchase” of positions Source: Diagnostics 1998
Citizen Voice and Access to Public Services by the Poor (Bolivia illustration, each observation is a public agency) Based on Public Officials Survey. The sample of institutions includes 44 national, departmental, and municipal agencies which are a prior anticipated to be accessible to the poor
Transparency within Government Agencies Prevents Purchase of Public Positions Based on 90 national, departmental, and municipal agencies covered in the Public Officials Survey.
Politicization of Public Agencies in Indonesia Lowers Transparency in Public Sector(Indonesian Public Official Survey – Very Preliminary Draft) Based on 36 public agencies covered in the Indonesia Public Officials Survey.
Public Sector Corruption in Indonesia Is Not Caused by Low Government Pay(Indonesian Public Official Survey – Very Preliminary Draft) Based on 36 public agencies covered in the Indonesia Public Officials Survey.
Lower Income Households ‘Pay’ Disproportionally Bribe/Total Income ratio % ( A Latin American Country )
BEEPS: Unbundling and Comparing Governance Constraints Across all countries in Transition (and beyond)
Recognizing the Problem of State Capture Vladimir Putin’s statement to Russia’s business leaders (last year): “I only want to draw your attention straightaway to the fact that you have yourselves formed this very state, to a large extent through political and quasi-political structures under your control, so perhaps what one should do least of all is blame the mirror.”
Defining State Capture Firms that shape the rules of the game to their advantage through illicit, non-transparent provision of private gains to public officials, including: • private purchase of legislative votes • private purchase of executive decrees • private purchase of court decisions • illicit political party financing
‘Captor’ Firms Get Big Gains – But only in High Capture States
At A Cost Of Greater Insecurity for All Others Share of Firms with Secure Property Rights
Transnational Corporate Responsibility Matters as Well: % of firms that 'Purchase' Legislation and Decrees in Transition Economies 12% 10% 8% % firms 'purchase' legislative 6% 4% 2% Domestic With Investor FDI Note: For transition economies, average of 20 countries. Source: Hellman, Jones and Kaufmann, 2000 (www.worldbank.org/wbi/governance)
Prevalence of Kickbacks for Public Procurement by FDI (by country of FDI origin, bribing in transition) Source: Hellman, Jones and Kaufmann 2000 (BEEPS in Transition). Estimates subject to margin of error.
Towards a Solution:More Political Competition Pace of Econ Reform Political Reforms
Concrete Implications: What can New Zealand FDI and exporters realistically do?(part I) • Work with NZ government to ensure thorough and transparent evaluation of OECD convention implementation by other members • Towards Pan-Asian anti-bribery convention • Power of Information: Survey, Expose, Shame and Disseminate – media, host governments, e*… • Business Associations activism abroad • Embassies of ‘cleaner gang of FDI countries’
Concrete Implications, part II: What can New Zealand FDI and exporters realistically do? 6. In systemically corrupt countries, stay away 7. In relatively corrupt countries, say No to bribery 8. Logic of collective action: credibly saying No to kickbacks and state capture – the high road • Pressure to have international public listings of corrupt firms debarred, such as the one at World Bank http://www.worldbank.org/html/opr/procure/debarr.html • NZ Foreign Aid: Support of good governance and Anticorruption programs in developing countries Collective Responsibility: AC = K.I + LE + CA
Overall Corruption Over Time (Selected Countries; ICRG index, rescaled 0-10) 10 High corruption Indonesia El Salvador 8 Russia Indonesia 6 Russia 4 El Salvador Poland 2 Poland Low corruption Finland Finland 0 1992 1993 1994 1995 1996 1997 1998 1988-92 7