Understanding Research Designs and Hypotheses in Multivariate Analysis**
This comprehensive guide delves into various research designs, focusing on true experiments, quasi-experiments, and non-experimental methods used in multivariate analyses. It explains the significance of random assignment, control of confounding variables, and outlines the distinctions between various types of research hypotheses: attributive, associative, and causal. The guide also explores statistical designs, including between-subjects and within-subjects frameworks. Understanding these concepts is crucial for designing robust studies and accurately interpreting outcomes in psychological and social research.

Understanding Research Designs and Hypotheses in Multivariate Analysis**
E N D
Presentation Transcript
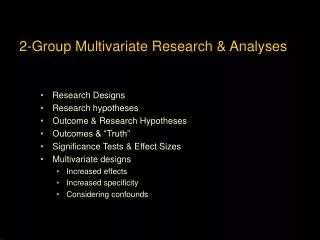
2-Group Multivariate Research & Analyses • Research Designs • Research hypotheses • Outcome & Research Hypotheses • Outcomes & “Truth” • Significance Tests & Effect Sizes • Multivariate designs • Increased effects • Increased specificity • Considering confounds
Research Designs True Experiments If “well-done,” can be used to test causal RH: -- alternative hyp. are ruled out because there are no confounds !!! True Experiment • random assignment of individual participants by researcher before IV manip (helps eliminate confounds) • treatment/manipulation performed by researcher (helps eliminate confounds) • good control of procedural variables during task completion & DV measurement (helps eliminate confounds) Quasi-Experiment • no random assignment of individuals (no confound control) • treatment/manipulation performed by researcher • poor or no control of procedural variables during task, etc. (no confound control) Non-Experiments No version can be used to test causal RH: -- can’t rule out alternative hyp. Because there are confounds !! Natural Groups Designalso calledConcomitant Measures orCorrelational Design • no random assignment of ind. (no confound control) • no treatment manipulation performed by researcher (all variables are measured) -- a comparison among participants already in groups (no confound control) • no control of procedural variables during task, etc. (no confound control) What designs “go with” what types of RH: ????
Basic Statistical Designs - BG vs. WG • Between Subjects (Between Groups) • each subject completes 1 of the IV conditions • different groups each complete 1 of the IV conditions • Within-subjects (Within-groups, Repeated Measures) • each subject completes all of the IV conditions • one group of subjects completes all of the IV conditions • “Design Language” • For both Between & Within designs, we refer to the IV and the DV • Typically the IV (“causal variable”) is qualitative • Typically the DV (“effect variable”) is quantitative • “SPSS Language” • Between Groups Designs • the IV is the “grouping variable” -- which IV condition each subject was in • the DVis the “response variable” and tells each participant’s score on the DV • Within-groups Designs • there is no IV -- each variable is referred to as a DV • there is one DV score for each IV condition • each DV score tells the participant’s score in that IV condition
ANOVA • Between Groups (Independent Samples, etc.) • H0: Populations represented by the IV conditions have the same mean DV. • degrees of freedom (df) numerator = 1, denominator = N - 2 • Range of values 0 to • Reject Ho: If Fobtained > Fcritical or If p < .05 • Within-groups (Dependent Samples, etc.) • H0: Populations represented by the IV conditions have the same mean DV. • degrees of freedom (df) numerator = 1, denominator = N - 1 • Range of values 0 to • Reject Ho: If Fobtained > Fcritical or If p < .05
Types of Research Hypotheses • Attributive Hypothesis -- a construct (phenomena, behavior, etc.) exists • an operational definition of the construct • a system to measure the construct • demonstration that the construct can be differentiated from other (related) constructs • Associative Hypothesis --two constructs are related (i.e., knowing the value of one provides information about the value of the other) • demonstration of a statistical relationship between the variables used to measure the constructs • specific statistical analysis is not important, as long as it is appropriate to the data and the expression of the research hypothesis
Causal Hypothesis -- the value of one construct influences (causes, produces, etc.) the value of the other construct • temporal precedence -- operation of IV comes before measurement of DV • no alternative hypotheses (no design flaws, confounds, alternative explanations of the results, etc.) • statistical relationship between IV and DV • The types of RH: are “hierarchically arranged” !! • Posing a causal hypothesis assumes the associative hypothesis that the IV and DV are related -- “if two things aren’t related then one can cause the other” • Posing an associative hypothesis assumes support for the attributive hypothesis of each construct/variable-- “unmeasureable things can’t be statistically analyzed”
2-group RH: and outcomes BG & WG... … and three possible statistical outcomes There are only three possible Research Hypotheses Research Hypotheses G1 < G2 G1 = G2 G1 > G2 Outcomes G1 < G2 G1 = G2 G1 > G2 ? ? ? ? ? ? ? ? So, there are only9 possible combinations of RH: & Outcomes … … of 3 types “effect as expected” “unexpected null/effect” “backward effect” ? ? ? ?
Keep in mind that rejecting H0: does notguarantee support for the research hypothesis? • Why not ??? • The direction of the mean difference might be opposite that of the RH: • The RH: might be that’s there’s no difference (RH: = H0:) • Also … replication of findings is important, even when you get what you expect !! ? ? ? ?
2-group outcomes & “truth” ... In the population there are only three possibilities... … and three possible statistical decisions In the Population G1 < G2 G1 = G2 G1 > G2 Decisions G1 < G2 G1 = G2 G1 > G2 Type I error Correctly rejected H0: Type III error Type II error Type II error Correctly retained H0: Type I error Type III error Correctly rejected H0: Please note that this is a different question than whether the results “match” the RH: This is about whether the results from the sample are “correct” – whether the results are “right.” This is about statistical conclusion validity
The 9 outcomes come in 5 types … Type I error -- “false alarm” - finding a significant mean difference between the conditions in the study when there really isn’t a difference between the populations Type II error -- “miss” - finding no difference between the conditions of the study when there really is a difference between the populations Type III error -- “misspecification” - finding a difference between the conditions of the study that is different from the the difference between the populations Correctly retained H0: -- finding no difference between the conditions of the study when there really is no difference between the populations Correctly rejected H0: -- finding a difference between the conditions of the study that is the same as the the difference between the populations
Practice with statistical decision errors evaluated by comparing our finding with “other research” … We found that those in the Treatment group performed the same as those in the Control group. However, the other 10 studies in the field found the Treatment group performed better, Type II We found that those in the Treatment group performed better than those in the Control group. This is the same thing the other 10 studies in the field have found. Correct Reject We found that those in the Treatment group performed poorer than those in the Control group. But all of the other 10 studies in the field found the opposite effect. Type III We found that those in the Treatment group performed better than those in the Control group. But none of the other 10 studies in the field found any difference. Type I We found that those in the Treatment group performed the same as those in the Control group. This is the same thing the other 10 studies in the field have found. Correct retain
Information from p-values “vs.” Effect Sizes • The p-value (value range 1.0 – 0) tells the probability of making a Type I error if you reject the H0: based on the data from this sample • e.g., p = .10 means “if we reject H0: based on these data there is a 10% chance that there really is no relationship between the variables in the population represented by the sample” • The usual “acceptable risk” is less than 5% or p < .05 • Effect size estimates (value range 0 – 1.0) tell how much of the variability in the DV is “accounted for” (“predicted from” or “caused by”) the IV • e.g., r = .30 means “we estimate that .302 or 9% of the variability in the DV is accounted for by the IV • “large enough to be interesting” effect sizes vary with research topics and design types, but a common guideline is .1 = small, .3 = medium and .5 = large
Calculating & Using Effect Sizes Effect Size “large enough “too small to be interesting” to be interesting” For 2-group ANOVA (BG or WG) r = F / (F + dferror) Significance Test p < .05 p > .05 Be careful about dismissing these – many “small effects” have turned out to be important “Best case” “big enough” & “probably really there” Which to “believe”? Rem - w/ small N comes lowered confidence in the replicability of r Easier to believe r if it replicates earlier research – then the large p-value is probably small N “Best case” “too small to care about” & “probably not really there”
Where we go from here ... 2-group designs with a single DV • multiple-group designs • single DV • multiple DVs 2-group designs with a multiple DVs • Factorial designs(2+ IVs) • single DV • multiple DVs Knowing the design & statistical analyses to directly test any research hypothesis involving treatment mean comparisons!!!
Multivariate Research -- when there are multiple DVs • Advantages of Multivariate Research • Increasing the Number of “Effects” in the Research • by including measures of multiple possible effects, we have a greater chance of finding “an effect” -- something that is influenced by or related to the IV • e.g., If the IV were some sort of clinical treatment, using the Beck Depression Inventory & State Anxiety Measure &Somatic Complaint Scale gives us a better chance of detecting some type of “improvement” than would using just one of these • research is costly (time & $) -- multiple measures typically add little to the cost but increase the chances of “finding something”
Advantages of Multivariate Research, cont. • Increasing the specificity of “the effects” we find • there is no one measure that is the perfect representation of “the effect” we are studying -- different measures of “the same thing” often are only moderately correlated (r = .3-.5) • using multiple related DVs allows us to more precisely define what is “the effect” • e.g., If the construct DV under study were anxiety, we might want to have measures of anxiety physiological measures, self-report measures, observational measures • that we we can better specify what we mean when we say ‘the treatment decreases anxiety” because we can say what types of anxiety showed the effect and which didn’t
Advantages of Multivariate Research, cont. • Combining the Two Approaches in a Single Study • multiple indices of multiple constructs - give the most precise and dependable results - greater chance of finding something influenced by IV - greater specificity about what is (& isn’t) influenced by IV - replication is still important • by using Beck Depression Inventory,MMPI Depression Scale, MCMI Depression Scale,State Anxiety Measure, Trait Anxiety Measure, Somatic Complaint Scale, MMPIHypochondriasis Scalewould allow us to determine if the treatment is specific to depression (& what “kind”), or includes anxietyand/or somatic complaints (& what “kinds”)
Using Multiple DVs in Quasi-Experimental and Natural Groups Designs • Remember that “confounds” come in two kinds • subject variable confounds • IV groups start with different means, on something like age, education, personality attributes or motivation • procedural variable confounds • during IV manipulation or DV measurement, something besides the IV is done differently between the IV conditions, like instructions, amount of stimulus exposure or practice • The presence of either type of confound interferes with the causal interpretation that mean differences on the DV indicate an effect of the IV • confounds provide an “alternative hypothesis” about what caused the DV differences for the IV conditions
Using Multiple DVs in Quasi-Experimental and Natural Groups Designs,cont. • Measuring subject variables that you fear may be subject variable confounds can help • any subject variable that doeshave a mean difference between IV conditions is a subject variable confound -- can’t causally interpret the results of the study !!! • that subject variable is an “alternative hypothesis” • any subject variable that does not have a mean difference between the IV conditions can’t possibly be a confounding subject variable • remember that a subject variable working “against” the IV is a confound (technically), but does not refute that the IV may be causing the effect! • you can’t give a causal interpretation to the study, but you can establish whether or not a particular subject variable is a likely “alternative hypothesis”
Multivariate approach to confound evaluation Design is a quasi-experiment w/o random assignment of participants – 2 different kinds of exam prep Intended DV % correct on the exam % grade on last exam GPA prior to this class Exam prep time (hrs) Credit card interest rate Tx control p r -- looks pretty good ! 89% 78% .02 .38 86% 77% .02 .37 2.87 2.86 .95 .001 2.22 2.78 .03 .29 14.3 17.1 .04 .12 -- effect in same direction a likely confound -- no effect – can’t be con-found of the IV-DV relationship -- a confound (even though not “inflating” the IV/DV relationship) – a “statistical” confound – relationship to DV is either complicated or spurious