Assessment of Ecological Quality in the Gallikos River Using the WFD Approach
This study evaluates the ecological quality of the Gallikos River in Macedonia, Greece, in accordance with the European Water Framework Directive (WFD 2000/60/EC). We assess biological, hydromorphological, and physicochemical parameters to determine water quality status. Sampling included macroinvertebrate analysis using kick-sampling methods, supported by biotic indices. Our results highlight the importance of biological indicators in evaluating water quality and contribute to effective river management strategies aimed at achieving 'good water status' by 2015.

Assessment of Ecological Quality in the Gallikos River Using the WFD Approach
E N D
Presentation Transcript
European Class 2005 The WFD approach at the River Gallikos in Makedonia, Hellas Sabrina Coste, Julia Hegner and Franηois Rose 13th May 2005 School of Biology - Aristoteles University Thessaloniki *
Contents • 1. Introduction • 2. Study Area • 3. Methods and Materials • 4. Discussion of Results • 5. Conclusion *
1. Introduction • The Water Framework Directive 2000/60 E.C. : • "good water status for all waters by 2015" • The Ecological Quality Ratio • Assessment of • Biological Parameters • Hydromorphological Parameters • Physicochemical Parameters *
Contents • 1. Introduction • 2. Study Area • 3. Methods and Materials • 4. Discussion of Results • 5. Conclusion *
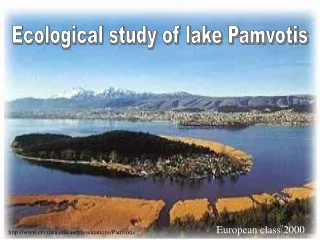
2. Study Area - Gallikos • Localisation • Coordinates: 40,48299 N : 22,51235 E • Sampling in beginning of March • Landuses *
Contents • 1. Introduction • 2. Study Area • 3. Methods and Materials • 4. Discussion of Results • 5. Conclusion *
3. Methods and Materials • A, Biological Parameters • Macroinvertebrate- Kick-Sampling • Biotic Indices and Scores • B, Hydromorphological Parameters • Greek Habitat Richness Matrix • River Habitat Survey (RHS) • C, Physicochemical Parameters • D, Statistical Analyses – Multivariate Technics • Primer • Simper • Fuzzy • Canoco *
A, Biological Parameters • Using macroinvertebrates, because …. • They don´t move a lot • Indicator organisms • Not difficult to sample and to identify • Sampling • Kick-sweep sampling • With standards pond net • 3 min + 1 min in all habitats at each site • Conservation with formol • After sampling : • In laboratory: animals are sorted and identify *
Tool and Technic • Kick – sweep sampling by Yorgos Chatzinikolaou • Pond net used to sample *
BIOTIC INDICES AND SCORES • Based on the principle that polluted waters are generally less diverse than comparable unpolluted waters. • All countries have different Biotic Indices or Scores : • The UKBiological Monitoring Working Party Score • • The IberianBiological Monitoring Working Party Score • • The Hellenic Evaluation Score *
The Hellenic Evaluation Score • Taxa • Present • Common • Abundant • Calculation of the Hellenic Biological Monitoring Working Party (HBMWP) score: Sum of all the results of the taxa • Calculation of the Hellenic Average Score Per Taxon (HASPT): HBMWP/ number of taxa • Decide whether the site is poor or rich according to Greek Habitat Richness Matrix (GHRM) • (0-1%) Case J • (1.01-10%) Case J • (>10%) Case J • ) Capniidae, Chloroperlidae, • β) Siphlonuridae, • γ) Aphelocheiridae, • 100 • 110 • 120 • δ) Blephariceridae • ε) Phryganeidae, Molanidae, Odontoceridae, Bareidae, Lepidostomatidae, Thremmatidae, Brachycentridae, Helicopsychidae *
Rich site Many types of habitats Poor site Few types of habitats • HBMWP • X • HASPT • Y • HBMWP • X • ASPT • Y • >1053 • 5 • >55,69 • 5 • >1532 • 5 • >64,72 • 5 • 756-1052 • 4 • 45,18-55,69 • 4 • 389-755 • 3 • 35,33-45,17 • 3 • 830-1325 • 3 • 45,82-54,56 • 3 • 167-388 • 2 • 27,50-35,32 • 2 • 341-829 • 2 • 31,73-45,81 • 2 • 0-166 • 1 • 0-27,49 • 1 • 0-340 • 1 • 0-31,72 • 1 • 4. Choose the respectively X/Y-Table • 5. Classify HBMWP score X • 6. Classify HASPT Y • 7. Final Calculation: (X+Y)/2 = HES *
8. Classification of the water quality • Semi-sum (HBMWP+HASPT) • Interpretation • 5 • excellent • 4,5 • Very good • 4 • Good • 3,5 • Good • 3 • Moderate • 2,5 • Moderate • 2 • Poor • 1,5 • Poor • 1 • Very poor *
The UK BMWP score • The BMWP score: • Benthic invertebrate are refered to a score based on their susceptibility to pollution • The ASPT: • BMWPT / number of taxa • The EQItaxa: • number of taxa observed / number of taxa predicted • The EQIaspt: • ASPT observed / ASPT predicted *
UK river classification scheme • Grade • Description • EQItaxa • EQIASPT • A • Very good • 0.85 • 1.0 • B • Good • 0.70 • 0.90 • C • Fairly good • 0.55 • 0.77 • D • Fair • 0.45 • 0.65 • E • Poor • 0.30 • 0.50 *
The Iberian BMWP score • Class • Quality • Score • Meaning • Differences to the UK BMWP: • news families that changes the score • 5 different levels of classification • Almost the same methodology as for the UK BMWP • I • Good • >150 • Very clean waters (pristine) • 101-150 • Not polluted, or not noticeably altered system • II • Passable • 61-100 • Evidence of effects of mild pollution • III • Dubious • 36-60 • Polluted waters (altered system) • IV • Critical • 16-35 • Very polluted waters (very altered system) • V • Very critical • <15 • Strongly polluted waters (strongly altered system) *
B, Hydromorphological Parameters • Greek Habitat Richness Matrix (GHRM) *
River Habitat Survey • The Hydromorphological Parameters were recording using the River Habitat Survey field method (RHS). • RHS = systematic collection of data associated with the physical structure of the watercourses based on a standard 500m length of a river channel: • 10 spot checks located at an interval of 50m recording the features associated with the physical structure of the watercourses (channel and bank morphologies, structures, modifications). • A sweep up report the general habitat of the channel and the management of adjacent land use. *
Data of the RHS are used for calculate the Habitat Quality Assessment (HQA) and the Habitat Modification Score (HMS) for each site. • HQA give a score indicating the habitat quality based on the physical features recorded in the RHS (version 1.2). • HMS provide a score expriming the extent of artificial modification to the physical structure of a river (version 1.1). • 5 Habitat Modification Categories *
C, Physicochemical Parameters • Following physicochemical parameters were measured in situ using a digital multimeter: Temperature, Total Dissolved Solids (TDS), Dissolved Oxygen (DO2), Conductivity, Salinity, pH, Cl-, NO3-, NH4+, NH3-, Turbidity and Chlorophyll • PO4-, BOD5 and Total Suspended Solids (TSS) were analysed in the laboratory • Relative abundance of each category of substrate (boulders, cobbles, pebbles, gravel, sand, silt) was estimated visually. • Water velocity was measured at the sampling stations using a flow meter. Discharge was calculated using measurement of velocity and depth at each tenth of the width of the river. *
D, Statistical Analyses • • Can be used to generate hypotheses about the causality of distribution of taxa. • • Can identify present discontinuities within the biological communities which can be related to environmental changes. • • Can be carried out on presence-absence data or quantitative data. • • Results, usually single figure, is a preferantial way to present data. *
Primer & Simper(Field et al., 1982) • • Produces a similarity dendrogram of sampling stations based on the presence – absence and the abundance of benthic macroinvertebrate taxa. • • Measures the similarity of stations and groups of stations, using the Bray-Curtis similarity index. • • Then by SIMPER analysis it may be explained which families of macroinvertebrates contribute to the similarity or dissimilarity between groups. *
Fuzzy (Equihua, 1990) • • Was performed in order to obtainordination and classification of the sites. • • Produces clusters according to the assemblages of benthic macroinvertebrates in each site, according to the membership value. • • The numbers of Fuzzy clusters are selected according to the higher partition coefficient. • • Does not assume the existence of discrete benthic populations along the various stretches of a river system. • • Identifies the continuum and gradual change of the sites’ faunal composition. Therefore it is suitable for the description of ecological communities. *
Canoco(Ter Braak, 1988) • • Analysing the relationships between the macroinvertebrate lowest taxonomic level, the sampling sites and the physicochemical parameters • • Is performed to detect covariances between environmental/external variables and respective biological components. • • Particularly suited for a forward selection of environmental variables in order to determine which variables have the greatest influence on the species community. *
Contents • 1. Introduction • 2. Study Area • 3. Methods and Materials • 4. Discussion of Results • 5. Conclusion *
4. Discussion of Results • A, Hydromorphological Parameters • B, Physicochemical Parameters • C, Biological Parameters • D, Statistical Analyses *
A, Hydromorphological Parameter RHS Galliko (close Nea Filadelphia) HQA score = 36 HMS score = 30 significantly modified Valley Shape Asymmetrical floodplain Channel substrate flow vegetation types modifications Gravel/pebbles + sand Ripples 4 No Banks material feature top face land use modifications Left Right Gravel/Sand Vegetation point bars simple complex Rough pasture embankment Earth + Gravel/Sand Eroding cliff uniform complex Tall herbs / rough pasture reinforced *
The Hellenic Evaluation Score • Taxa • HASPT • HBMWP • Score • Quality • G01 • 20 • 47,5 • 950 • 3 • moderate • G02 • 16 • 52,25 • 836 • 3 • moderate • G03 • 16 • 48 • 768 • 2,5 • moderate *
COMPARATION OF TWO BIOTIC SCORE • IBERIAN SCORE • HELLENIC SCORE • Score • Quality • Score • Quality • G01 • 64 • passable • 3 • moderate • G02 • 50 • polluted water • 3 • moderate • G03 • 56 • polluted water • 2,5 • moderate *
D, Statistical Analyses • Primer • Simper • Fuzzy • Canoco *
Primer • Similarity • AB7, G01, G02 + G03 (Gammaridae,Baetidae) • -A067, A054, A034 + A021 (Miscidaceae,Chironomidae) • - A006 close to the sea *
Fuzzy • Similarity • G01, G02 + G03 (Gammaridae,Baetidae, Chironomidae) • -A067, A054, A034 + A021 (Miscidaceae,Chironomidae) • A006 close to the sea • AB7 tributary *
Canoco *
Contents • 1. Introduction • 2. Study Area • 3. Methods and Materials • 4. Discussion of Results • 5.Conclusion *
After this Case Study … • … we can not make a reliable statement about the water quality of the River Gallikos according to the WFD • No monitoring of all recommended biological parameters • Only once, not following the recommended monitoring frequencies • No monitoring of the whole managment unit • … but it was enough for … • … getting an overview about how the monitoring is carried out • … understanding the correlation between the different parameters • … getting to know the main principles and methods of the WFD • … experiencing and working in an international team *
References All course documents on Blackboard http://edu.bio.auth.gr/wq Environment Agency (1997) River Habitat Survey: 1997 Field Survey Guidance Manual, Incorporating Sercon. Equihua, M. (1990). FUZZY clustering of ecological data. J. Ecol. 78. pp. 519-534 Lazaridou-Dimitriadou, M. et al. (2004) Assessment of the Water and habitat Quality of a Mediterranean River (Kalamas, Epirus, Hellas), in Accordance with the EU Water Frame Work Directive. Acta hydrocim. Hydrobiol. 32, 3, p. 175-188 *