Download

1 / 32
410 likes | 1.07k Vues
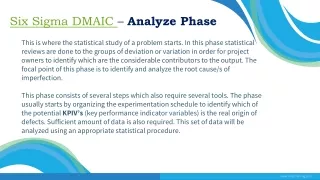
Analyze Phase. Lean Six Sigma Analyze Phase Tollgate Review. Lean Six Sigma DMAIC Tools and Activities. Review Project Charter Validate High-Level Value Stream Map and Scope Validate Voice of the Customer & Voice of the Business

E N D
Analyze Phase • Lean Six Sigma Analyze Phase Tollgate Review
Lean Six Sigma DMAIC Tools and Activities • Review Project Charter • Validate High-Level Value Stream Map and Scope • Validate Voice of the Customer & Voice of the Business • Validate Problem Statement and Goals • Validate Financial Benefits • Create Communication Plan • Select and Launch Team • Develop Project Schedule • Complete Define Tollgate • Value Stream Map Flow • Identify Key Input, Process and Output Metrics • Develop Operational Definitions • Develop Data Collection Plan • Validate Measurement System • Collect Baseline Data • Determine Process Capability • Complete Measure Tollgate • Identify Root Causes • Reduce List of Potential Root Causes • Confirm Root Cause to Output Relationship • Estimate Impact of Root Causes on Key Outputs • Prioritize Root Causes • Value-Add Analysis • Takt Rate Analysis • Quick Wins • Statistical Analysis • Complete Analyze Tollgate • Develop Potential Solutions • Evaluate, Select, and Optimize Best Solutions • Develop ‘To-Be’ Value Stream Map(s) • Develop and Implement Pilot Solution • Implement 5s Program • Develop Full Scale Implementation Plan • Cost/Benefit Analysis • Benchmarking • Complete Improve Tollgate • Develop SOP’s, Training Plan & Process Controls • Implement Solution and Ongoing Process Measurements • Confirm Attainment of Project Goals • Identify Project Replication Opportunities • Training • Complete Control Tollgate • Transition Project to Process Owner Improve Control Define Analyze Measure • Mistake-Proofing/Zero Defects • Standard Operating Procedures (SOP’s) • Process Control Plans • Visual Process Control Tools • MGPP • Statistical Process Controls (SPC) • Solution Replication • Visual Workplace • Metrics • Project Transition Model • Team Feedback Session • Replenishment Pull/Kanban • Stocking Strategy • Process Flow Improvement • Process Balancing • Analytical Batch Sizing • Total Productive Maintenance • Design of Experiments (DOE) • Solution Selection Matrix • Piloting and Simulation • Work Control System • Setup reduction • Pugh Matrix • Pull System • Value Stream Mapping • Process Cycle Efficiency/Little’s Law • Operational Definitions • Data Collection Plan • Statistical Sampling • Measurement System Analysis (MSA) • Gage R&R • Kappa Studies • Control Charts • Spaghetti Diagrams • Histograms • Normality Test • Process Capability Analysis • Process Constraint ID and Takt Time Analysis • Cause & Effect Analysis • FMEA • Hypothesis Tests/Conf. Intervals • Simple & Multiple Regression • ANOVA • Components of Variation • Conquering Product and Process Complexity • Queuing Theory • Project Charter • Voice of the Customer and Kano Analysis • SIPOC Map • Project Valuation/ROIC Analysis Tools • RACI and Quad Charts • Stakeholder Analysis • Communication Plan • Effective Meeting Tools • Inquiry and Advocacy Skills • Time Lines, Milestones, and Gantt Charting • Pareto Analysis Kaizen Events Targeted in Measure to Accelerate Results International Standards for Lean Six Sigma
Measure Overview • CTQ: ? • Unit (d) or Mean (c): ? • Defect (d) or St. Dev. (c): ? • PCE%: ? • DPMO (d): ? • Sigma (Short Term): ? • Sigma (Long Term):? • MSA Results: show the percentage result of the GR&R, AR&R or other MSA carried out in the project Process Capability Graphical Analysis Tools Used Root Cause / Quick Win • Time Series Plot • Probability Plot • Pareto Analysis • Operational Def. • 5s • Pull • Control Charts • Detailed process mapping • MSA • Value Stream Mapping • Data Collection Planning • Basic Statistics • Process Capability • Histograms • Root cause: • Quick Win #1 • Root cause: • Quick Win #2 • Root cause: • Quick Win #3 Enter Key Slide Take Away (Key Point) Here International Standards for Lean Six Sigma
Graphical Analysis Summary Data is Continuous: ?? Data Points Collected Between XX/XX/XX and XX/XX/XX NormalityCentral TendencyVariation Normal Average Std. Dev (long term) Non-Normal Median or Q1 or Q3 Span (1/99) or Stability Factor (Q1/Q3) Enter Key Slide Take Away (Key Point) Here International Standards for Lean Six Sigma
Sources of Waste Overproduction Transportation Sources of Waste • ? • ? • ? • ? • ? Defect Area 1 Area 1 Area 1 Sub area 1 Sub area 1 Sub area 1 NVA Area 1 Area 1 Area 1 Sub area 1 Sub area 1 Sub area 1 Processing Inventory Waiting Motion < Insert your waste percentage as shown in pie chart > Enter Key Slide Take Away (Key Point) Here International Standards for Lean Six Sigma
Cause and Effect MatrixC&E Matrix (Optional) • ? • ? Enter Key Slide Take Away (Key Point) Here International Standards for Lean Six Sigma
Pareto Plot Enter Key Slide Take Away (Key Point) Here International Standards for Lean Six Sigma
Hypothesis Test Summary Enter Key Slide Take Away (Key Point) Here International Standards for Lean Six Sigma
Control / Impact Analysis Does the X have a high, medium, or low impact on the project Y? Does the X in he teams control, influence, or out of their control? Enter Key Slide Take Away (Key Point) Here International Standards for Lean Six Sigma
Quick Win Documentation Template • Root Cause: _________________________________________________ • Obvious Solution: __________________________________________ • Low or No Cost: __________________________________________ • Low Risk: ________________________________________________ • Implementation Plan: ______________________________________________ • Stakeholder (s) Approval: ___________________________________________ Process Name: __________________ Process Lead: ___________________ Process Owner: ______________________ Start Date: ______________ Process Area: ________________________ Stop Date: ______________ • 5s • 4-Step Setup Reduction • Inventory Reduction • MSA Improvements • Price reductions • Reduced DOWNTIME (NVA steps or work) • Pull System • Kaizen events • Other Benefits: • __________________________________________________________ • __________________________________________________________ • __________________________________________________________ Enter Key Slide Take Away (Key Point) Here International Standards for Lean Six Sigma
Business Impact • State financial impact of future project leverage opportunities • Separate “hard or Type 1” from “soft Type 2 or 3” dollars Enter Key Slide Take Away (Key Point) Here International Standards for Lean Six Sigma
Business Impact Details • Type 1: Describe the chain of causality that shows how you determined the Type 1 savings. (tell the story with cause–effect relationships, on how the proposed change should create the desired financial result (savings) in your project ) • Show thefinancial calculation savings and assumptions used. • Assumption #1 (i.e. source of data, clear Operational Definitions?) • Assumption #2 (i.e. hourly rate + incremental benefit cost + travel) • Type 2: Describe the chain of causality that shows how you determined the Type 2 savings. (tell the story with cause–effect relationships, on how the proposed change should create the desired financial result (savings) in your project ) • Showthe financial calculation savings and assumptions used. • Assumption #1 (i.e. Labor rate used, period of time, etc…) • Assumption #2 (i.e. contractor hrs or FTE, source of data, etc…) • Describe the Type 3 Business Impact(s) areas and how these were measured • Assumption #1 (i.e. project is driven by the Business strategy?) • Assumption #2 (i.e. Customer service rating, employee moral, etc…) • Other Questions • Stakeholders agree on the project’s impact and how it will be measured in financial terms? • What steps were taken to ensure the integrity & accuracy of the data? • Has the project tracking worksheet been updated? Enter Key Slide Take Away (Key Point) Here International Standards for Lean Six Sigma
Current Status • Key actions completed • Issues • Lessons learned • Communication, team building, organizational activities Enter Key Slide Take Away (Key Point) Here International Standards for Lean Six Sigma
Next Steps • Questions to answer • Barrier/risk mitigation activities • Key actions • Planned Lean Six Sigma Tool use Enter Key Slide Take Away (Key Point) Here International Standards for Lean Six Sigma
Sign Off • I concur that the Analyze phase was successfully completed on MM/DD/YYYY • I concur the project is ready to proceed to next phase: Analyze Enter Name Here Green Belt/Black Belt Enter Name Here Deployment Champion Enter Name Here Sponsor / Process Owner Enter Name Here Financial Representative Enter Name Here Master Black Belt Enter Key Slide Take Away (Key Point) Here International Standards for Lean Six Sigma
Tollgate ReviewsBackup Slides Halt - Hold D M A I C Go Forward Wait - Go Back
Project Charter Problem:Describe problem in non-technical terms • Statement should explain why project is important; why working on it is a priority Goal: Goals communicate “before” and “after” conditions • Shift mean, variance, or both? • Should impact cost, time, quality dimensions • Express goals using SMART criteria • Specific, Measurable, Attainable, Resource Requirements, Time Boundaries • Explain leverage and strategic implications (if any) Problem/Goal Statement Financial Impact • State financial impact of project • Expenses • Investments (inventory, capital, A/R) • Revenues • Separate “hard” from “soft” dollars • State financial impact of leverage opportunities (future projects) Team Tollgate Review Schedule • PES Name Project Executive Sponsor (if different from PS) • PS Name Project Sponsor/Process Owner • DC Name Deployment Champion • GB/BB Name Green Belt/Black Belt • MBB Name Master Black Belt • Core Team Role % Contrib. LSS Training • Team Member 1 SME XX YB • Team Member 2 TM XX GB • Team Member 3 SME XX PS • Extended Team • Team Member 1 BFM XX Not Trained • Team Member 2 IT XX Not Trained TollgateScheduledRevisedComplete Define: XX/XX/XX - XX/XX/XX Measure: XX/XX/XX XX/XX/XX XX/XX/XX Analyze: XX/XX/XX XX/XX/XX XX/XX/XX Improve: XX/XX/XX XX/XX/XX XX/XX/XX Control: XX/XX/XX XX/XX/XX XX/XX/XX • Review high-level schedule milestones here: • Phase Completions • Tollgate Reviews Enter Key Slide Take Away (Key Point) Here International Standards for Lean Six Sigma
MeasureTollgate Checklist Stop Tollgate Review • Has a more detailed Value Stream Map been completed to better understand the process and problem, and where in the process the root causes might reside? • Has the team conducted a value-added and cycle time analysis, identifying areas where time and resources are devoted to tasks not critical to the customer? • Has the team identified the specific input (x), process (x), and output (y) measures needing to be collected for both effectiveness and efficiency categories (i.e. Quality, Speed, and Cost measures)? • Has the team developed clear, unambiguous operational definitions for each measurement and tested them with others to ensure clarity/consistent interpretation? • Has a clear, reasonable choice been made between gathering new data or taking advantage of existing data already collected by the organization? • Has an appropriate sample size and sampling frequency been established to ensure valid representation of the process we’re measuring? • Has the measurement system been checked for repeatability and reproducibility, potentially including training of data collectors? • Has the team developed and tested data collection forms or check sheets which are easy to use and provide consistent, complete data? • Has baseline performance and process capability been established? How large is the gap between current performance and the customer (or project) requirements? • Has the team been able to identify any complete ‘Quick Wins’? • Have any Kaizen opportunities been identified to accelerate momentum and results? • Have key learning(s) to-date required any modification of the Project Charter? If so, have these changes been approved by the Project Sponsor and the Key Stakeholders? • Have any new risks to project success been identified, added to the Risk Mitigation Plan, and a mitigation strategy put in place? Key Deliverables: • Detailed Value Stream Map(s) • Data Collection Plan • Measurement Collection Results • Process Capability Results • Current Baseline Process Performance • Quick Wins, if applicable • Identification of Kaizen Opportunities, if applicable • Refined Charter, as necessary • Updated Risk Mitigation Plan • Deliverables Uploaded to Central Storage Location or Deployment Management System. Enter Key Slide Take Away (Key Point) Here International Standards for Lean Six Sigma
AnalyzeTollgate Checklist Stop Tollgate Review • Has the team examined the process and identified potential bottlenecks, disconnects and redundancies that could contribute to the problem statement? • Has the team analyzed data about the process and its performance to help stratify the problem, understand reasons for variation in the process, and generate hypothesis as to the root causes of the current process performance? • Has an evaluation been done to determine whether the problem can be solved without a fundamental recreation of the process? Has the decision been confirmed with the Project Sponsor? • Has the team investigated and validated (or devalidated) the root cause hypotheses generated earlier, to gain confidence that the “vital few” root causes have been uncovered? • Does the team understand why the problem (the Quality, Cycle Time or Cost Efficiency issue identified in the Problem Statement) is being seen? • Has the team been able to identify any additional ‘Quick Wins’? • Have learning’s to-date required modification of the Project Charter? If so, have these changes been approved by the Project Sponsor and the Key Stakeholders? • Have any new risks to project success been identified, added to the Risk Mitigation Plan, and a mitigation strategy put in place? Deliverables: • List of Potential Root causes • Prioritized List of Validated Root Causes • Additional “Quick Wins”, if applicable • Refined Charter, as necessary • Updated Risk Mitigation Plan • Deliverables Uploaded to Central Storage Location or Deployment Management System Has the team identified the key factors (critical X’s) that have the biggest impact on process performance? Have they validated the root causes? International Standards for Lean Six Sigma 19
ImproveTollgate Checklist Stop Tollgate Review • What techniques were used to generate ideas for potential solutions? • What narrowing and screening techniques were used to further develop and qualify potential solutions? • What evaluation criteria were used to select a recommended solution? • Do proposed solutions address all the identified root causes, at least the most critical? • Were the solutions verified with the Project Sponsor and Stakeholders? Has an approval been received to implement? • Was a pilot run to test the solution? What was learned? What modifications made? • Has the team seen evidence that the root causes of the initial problems have been addressed during the pilot? What are the expected benefits? • Has the team considered potential problems and unintended consequences (FMEA) of the solution and developed preventive and contingency actions to address them? • Has the proposed solution been documented, including process participants, job descriptions and if applicable, their estimated time commitment to support the process? • Has the team developed an implementation plan? What is the status? • Have changes been communicated to all the appropriate people? • Has the team been able to identify any additional ‘Quick Wins’? • Have ‘learning's’ to-date required modification of the Project Charter? If so, have these changes been approved by the Project Sponsor and the Key Stakeholders? • Have any new risks to project success been identified and added to the Risk Mitigation Plan? Deliverables: • Prioritized List of Solutions • “To-Be” Value Stream Map(s) • Pilot Plan & Results • Approved Solution and Detailed Implementation Plan • Additional “Quick Wins”, if applicable • Refined Charter, as necessary • Updated Risk Mitigation Plan • Deliverables Uploaded to Central Storage Location or Deployment Management System Has the team developed improvement solutions for the critical X’s, piloted the solution and verified that the solution will solve the problem? International Standards for Lean Six Sigma 20
Lean Six Sigma DMAIC Improvement Process • Define the opportunity from both the customer and business perspective Define Tollgate Review • Understand the baseline process performance Stop Measure • Identify the critical X factors and root causes impacting process performance Tollgate Review Analyze Stop Tollgate Review • Develop solutions linked to critical x’s Stop Improve Tollgate Review Stop • Implement solutions & control plan Control Enter Key Slide Take Away (Key Point) Here International Standards for Lean Six Sigma
Run Charts (Optional) Enter Key Slide Take Away (Key Point) Here International Standards for Lean Six Sigma
Scatter Plot(Optional) Average Expenses decrease as Sales Increase Enter Key Slide Take Away (Key Point) Here International Standards for Lean Six Sigma
Linear Regression(Optional) • 95% confident that 94.1% of the variation in “Wait Time” is from the “Qty of Deliveries” Enter Key Slide Take Away (Key Point) Here International Standards for Lean Six Sigma
One-Sample T-Test and Dot Plot (Optional) This Dot Plot graphically displays 95% confidence intervals that the data will fall between 23.45 and 32.75 for response time (see the red brackets and red line). It also indicates that the Mean (Red X) is at 28.1. The blue Ho marks the Target Mean. We Are 95% Confident The Improve Mean Is Not Statistically Different Hypothesis Test: Is the Improve data set mean different from the Target Mean mean of 30 minutes? The test statistic, T, for Ho: mean = 30 is calculated as –0.84. The P-Value of this test, or the probability of obtaining more extreme value of the test statistic by chance if the null hypothesis was true, is 0.410 (> 0.05). This is called the attained significant level, or P-Value. Therefore, Accept Ho, which means we conclude that the Improve data set mean (28.1) is NOT different than the Target mean (30). One-Sample T: Improve Data Test of mu = 30 vs mu not = 30 Variable N Mean StDev SE Mean Improve Data 30 28.10 12.45 2.27 Variable 95.0% CI T P Improve Data (23.45, 32.75) -0.84 0.410 Enter Key Slide Take Away (Key Point) Here International Standards for Lean Six Sigma
Test for Equal Variance (Optional) Test for Equal Variance Confirms Payroll Input Type Cycle Time is Significant The spread of the data is statistical greater for completing the payroll form than the Antenna time tracking. Enter Key Slide Take Away (Key Point) Here International Standards for Lean Six Sigma
One Way ANOVA (Optional) • After further investigation, possible reasons proposed by the team are supplier backorders, lack of technician certifications and the distance from the supplier to the client site. • It is also caused by the need for technicians to make a second visit to the end user to complete the part replacement. Next step will be for the team to confirm these suspected root causes. Box Plot: Part/ No Part Impact on Ticket Cycle Time Analysis of Variance for Net Hour Source DF SS MS F P Part/No 1 7421 7421 8.65 0.004 Error 69 59194 858 Total 70 66615 Individual 95% CI's For Mean Level N Mean StDev --+---------+---------+---------+---- No Part 27 21.99 19.95 (--------*---------) Part 44 43.05 33.70 (------*------) --+---------+---------+---------+---- Pooled StDev = 29.29 12 24 36 48 • Because the p-value <= 0.05, we can be confident that calls requiring parts do have an impact on the ticket cycle time. Enter Key Slide Take Away (Key Point) Here International Standards for Lean Six Sigma
Mood’s Median (Optional) • After further investigation, possible reasons proposed by the team are supplier backorders, lack of technician certifications and the distance from the supplier to the client site. • It is also caused by the need for technicians to make a second visit to the end user to complete the part replacement. Next step will be for the team to confirm these suspected root causes. Dot Plot: Part/ No Part Impact on Ticket Cycle Time Chi-Square = 19.14 DF = 2 Mood’s Median Test P = 0.000 Individual 95.0% Confidence Interval’s Month N<= N> Median Q3-Q1 ------+---------+---------+---------+ 10 88 132 8.43 12.15 (--------+-------) 11 123 121 6.57 10.52 (------+------) 12 111 68 4.77 7.10 (-----+------) ------+---------+---------+---------+ Overall Median 6.63 4.8 6.4 8.0 9.6 Because the p-value <= 0.05, we can be confident that calls requiring parts do have an impact on the ticket cycle time. Enter Key Slide Take Away (Key Point) Here International Standards for Lean Six Sigma
Statistical Testing for Discrete Data (Optional) Because this p value is less than 5% (0.05), we can be confident that department does have an impact on the proportion of correct tickets processed This is due to the fact that Department 4 has fewer people who need to add information to each ticket, which reduces the chances that an error will be made. Also, in Department 4 the customer name, address and ticket number are added directly from the contracts system without human intervention, reducing the possibility that a typo or other error type could occur that will need to be corrected later (taking more time) Enter Key Slide Take Away (Key Point) Here International Standards for Lean Six Sigma
Takt Rate Analysis compares the task time of each process (or process step) to: Each other to determine the time trap Customer demand to determine if the time trap is the constraint Process Takt Rate & Workload Balancing (Optional) Net Process Time Available Number of Units to Process Takt Time = Enter Key Slide Take Away (Key Point) Here International Standards for Lean Six Sigma
In/Out of Frame(Optional) Creating a visual depiction of what elements of the project are in the scope (frame) and out of the scope Vital X #7 Vital X #8 Vital X #2 Vital X #3 Vital X #5 Influence No Control Control Vital X #4 Vital X #1 Vital X #6 Vital X #9 Enter Key Slide Take Away (Key Point) Here International Standards for Lean Six Sigma
Systems & Structures Assessment (Optional) Enter Key Slide Take Away (Key Point) Here International Standards for Lean Six Sigma