Download
1 / 13
130 likes | 219 Vues
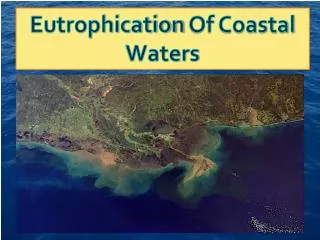
MOLTEN. *. *. *. MOLTEN MOnitoring Long-term Trends in Eutrophication and Nutrients in the coastal zone. Determination of reference conditions in coastal and transitional water. Richard Telford Geography Department, Newcastle University Stephen Juggins Annemarie Clarke Simon Drew

E N D
MOLTEN * * * MOLTEN MOnitoring Long-term Trends in Eutrophication and Nutrients in the coastal zone Determination of reference conditions in coastal and transitional water. Richard TelfordGeography Department, Newcastle UniversityStephen Juggins Annemarie ClarkeSimon Drew Elinor Andren Uppsala University, Sweden Kaarina Weckström ECRU, University of Helsinki, FinlandAtte Korhola John Anderson Institute of Geography, Copenhagen University, DenmarkMarianne Ellegaard Victor de Jonge Dept. Marine Biology, Groningen University, The Netherlands Heikki Pitkänen Finnish Environment Institute, Finland Daniel Conley National Environmental Research Institute, Denmark
MOLTEN Normative definitions of ecological status classifications Good Status The values of the biological quality elements for the surface water body type show low levels of distortion resulting from human activity, but deviate only slightly from those normally associated with the surface water body type under undisturbed conditions. Table 1.2. General definition for rivers, lakes, transitional waters and coastal waters L 327/38 22.12.2000 Official Journal of the European Communities
MOLTEN …undisturbed conditions • How can they be defined? The MOLTEN approach • Quantitative palaeoecology • Transfer functions • Multiproxy study • Stable isotopes • Pigments • Dinoflagellates • Forams • Diatoms
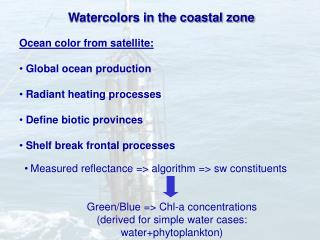
MOLTEN a n a e e h r c o t s n m a u i s i h r u u m w a l a l c i a i s i c n e a a t i i b n t t t e o i l m m i b u s c e a i c h r s o c s s m l t b g o i s u h o f s i a m h c a l a s r u i r i i s a f c i g c r d e a s y s l s t l o a e o n i o i i i r l p e h e s d o h t e a o s n p o o c c n l p l a m o s i l e c l t c a o z a m p o y t c y p h i h i i A H C O C T R N D D 1996 1980 1970 Transfer Function 1950 1930 1900 Transfer Function? Contemporary water chemistry Surface Sample Sediment core Modern diatoms Calibration dataset Fossil diatoms Reconstruction
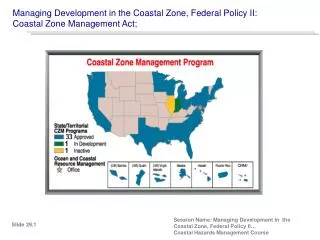
MOLTEN Molten Sites
MOLTEN Min Max Depth m 0.5 50.5 Molten Statistics Number of Sites 226 Number of Species 852 328 >1% Salinity ‰ 0.05 31.7 TN mg/l 231.8 3890 TP mg/l 14.5 463.2
Species response: Rhoicosphenia curvata MOLTEN TP (µg/l) L 5 0 . 0 4 0 . 0 n 3 o 0 i t . r 0 o p o r p 2 0 . 0 1 0 . 0 0 . 0 1.4 1.6 1.8 2.0 2.2 2.4 2.6 Salinity (‰) L TN (µg/l) L 5 5 0 . 0 . 0 0 4 4 0 0 . . 0 0 n n 3 3 o o 0 i 0 i t . t . r r 0 0 o o p p o o r r p p 2 2 0 0 . . 0 0 1 1 0 0 . . 0 0 0 0 . . 0 0 2.4 2.6 2.8 3.0 3.2 3.4 3.6 5 10 15 20 25 30
Species response: Cymatosira belgica MOLTEN TP (µg/l) G 0 2 . 0 5 1 . 0 n o i 0 t r 1 o . 0 p o r p 5 0 . 0 0 . 0 1.4 1.6 1.8 2.0 2.2 2.4 2.6 Salinity (‰) TN (µg/l) L G 0 0 2 2 . . 0 0 5 5 1 1 . . 0 0 n n o i o 0 t i r 0 t 1 r o . 1 o 0 p . 0 p o r o p r p 5 0 5 . 0 0 . 0 0 . 0 0 . 0 2.4 2.6 2.8 3.0 3.2 3.4 3.6 5 10 15 20 25 30
MOLTEN 2.0 TP Chl- a TN 1.0 NO n PO 4 Oxygen Depth NO:PO 0.0 n4 NH 2 4 s i x A Secchi Depth -1.0 -2.0 Salinity -3.0 -2.0 -1.0 0.0 1.0 2.0 3.0 Axis 1 Danish Dataset : CCA biplot showing sites % Variation explained total unique Depth 9.0 6.6 Salinity 6.5 5.3 Secchi 6.2 2.7 NH4 4.9 3.3 TN 4.7 2.5
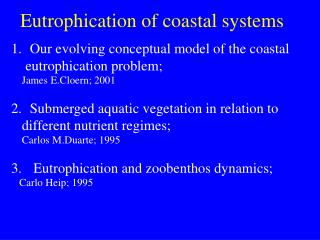
MOLTEN RMSE = 0.008 r2 = 0.9 RMSEP = 0.13 r2 = 0.71 Log10 Diatom-inferred TN Log10 Measured TN Predicted vs. measured TN for Danish dataset
MOLTEN Application of the Transfer Function: Roskilde Fjord
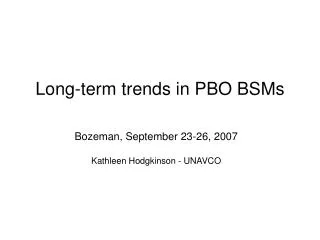
MOLTEN Inferred Total Nitrogen Roskilde Fjord Diatom Stratigraphy
MOLTEN Conclusions • There is a significant relationship between diatoms and TN in Coastal and Transitional waters. • This can be used to estimate background TN levels. • TN almost doubled in Roskilde Fjord between 1956 and 1995. • This methodology is being applied to new sites. http://Craticula.ncl.ac.uk:8000