Download
1 / 38
380 likes | 861 Vues
BioQUEST Evolution Modules Frank Price Scholar in Residence, Hamilton College fprice@hamilton.edu (315) 853–5233 in collaboration with other members of the BioQUEST Curriculum Consortium BioQUEST: Bio logy Q uality U ndergraduate E ducational S imulations & T ools

E N D
BioQUEST Evolution Modules Frank Price Scholar in Residence, Hamilton College fprice@hamilton.edu (315) 853–5233 in collaboration with other members of the BioQUEST Curriculum Consortium
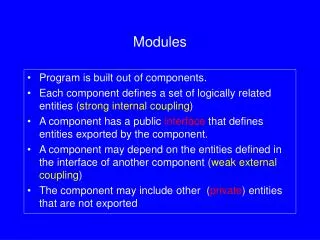
BioQUEST: Biology Quality Undergraduate Educational Simulations & Tools • Consortium of ≈150 active members & ≈5,000 fellow-travelers • Dedicated to Biology Curriculum Reform
BioQUEST Philosophy • 3 Peas: • Problem Posing • Problem Solving • Peer Persuasion • Students need to do what professionals do: • Ask their own questions. • Find appropriate data. • Analyze data with appropriate professional tools. • Answer their questions. • Persuade peers of the value of their answers. • They need opportunities to work in the context of the discipline
BioQUEST Philosophy • Inquiry–oriented approach • Goals, assumptions, models, history become explicit • Promote interpretation of data • Effect-to-cause reasoning • Encourages multivariate approaches • Encourage collaboration • Advantages of collaborative learning • Multiple modes of learning, • Multiple skills • De-emphasize “content” relative to skills • Emphasize Information Technology as a tool • Supplement, not replace, actual lab/field work
Active Howard Hughes Medical Institute, National Science Foundation*, Division of Undergraduate Education Partnership for Advanced Computing Infrastructure Previous : Annenberg/CPB Foundation for Microbiology Beloit College University of Chicago Center for Biology Education, UW - Madison Apple Computer Pew Midstates Science & Mathematics Consortium BioQUEST Funding * 24 Funded NSF grants cite BioQUEST Library resources
Background & Pedagogy Behavior Biomathematics Botany Cell Biology Development Ecology Evolution General Biology Genetics Microbiology Molecular Biology Molecular Visualization Mycology Zoology Physiology Statistics Tools Zoology BioQUEST Modules: Disciplines
The Problems With Evolution Educaton: • Evolution is widely misunderstood – We don’t teach it well • Lack of Labs – Time and space – Variety of data & methods – Pedagogical models • Lack of Data
Key Pedagogical Points:Goals for Students • Understanding of products of evolutionary biology (state of the art) • Theory • History • Learn assumptions that frame thinking • Practice methods
Key Pedagogical Points: Evolutionary Biology • Goals of Evolutionary Inquiry • Theory: models of processes/phenomena • History: phylogenies as historical hypotheses • Shared assumptions, e.g.: • Species as gene pool w/ genetic variation • New variation continuous, random • Evolution: statistical change of population • Historical contingency • Methodologies & Tools • Various
BIRDDDataLibrary (Mac, Win) EVOLVESimulation: microevolution (Mac) Biology Student WorkbenchAnalytical tool (Mac, Win) MacClade 2.1Analytical tool (Mac) Phylogenetic InvestigatorInstructional tool (Mac) BeeVisitSimulation: pollination (Win) BGuILE: Galapagos FinchesSimulation: ecology, selection (Mac) BGuILE: TB LabSimulation : antibiotic selection (Mac) Bumpus Numeric Dataset (Mac, Win) Caminicules Visual dataset (Mac, Win) Dendrograminaceae Visual dataset (Mac, Win) BioQUEST Modules: Evolution
On–Line Info: • BioQUEST Curriculum Consortium:http://bioquest.org/ • BioQUEST Liberary purchase:http://www.apnet.com/bioquest/(Academic Press)
Our Solution: BIRDD • Digital library of raw data: – Realistic – Accessible – Exportable • Open–ended • Instructional Support: – Getting Started – Classroom Examples – Teaching Evolutionary Biology
Opportunities • For students • Senior Projects • Database development (possible summer stipend) • Student teaching • For faculty • Material for labs • Evolution, Ecology, Intro. Biol., animal morphology, Statistics, etc. • Opportunities for student projects • In courses • Database development • “Publish” your data
BIRDD Has Been Tested At: • Beloit College (small, liberal arts): • Zoology: non–major’s intro. (Paul Whittaker) • Biological Issues, Making Sense of Evolutionary Explanations: non–major’s (Sam Donovan) • Evolution: major’s (John Jungck) • U. WI, Madison • Introductory Zoology: major’s intro., > 800 students/semester (Jean Heitz)
Jean Heitz’ Approach to Using BIRDD: Grant Proposals ( Used in Introductory Zoology, UWI, Madison) • Week 1: • Acquaint students w/ BIRDD, Galapagos, finches • Find some preliminary questions • Week 2: • Present ideas to whole lab for critique • Revise, develop preliminary answers • More thorough analysis of data, • Week 3: • Present 2nd proposal draft to whole lab for critique • Write final propsal • Week 4: Turn in proposal
Availability: • BioQUEST Library CD–ROMindiv: $99* ISBN: 0-12-099470-4 Site: $650 U/C* • Macintosh: $350 HS – System 7, System 7.1+ suggested, 4 MB available RAM • Windows: Windows 3.1+, Windows 95 + suggested, 8 MB available RAM. • Both: 180 MB of free hard disk space, color monitor with 800 x 600+ resolution, QuickTime® 3+ to play panorama & sound files.
Data Resources:Islands • Area • Max. Elevation • Age • Vegetation zones • Topographic map • Breeding status of each finch species Number of species of: --------------------------------------------------------------------------------------- • Ferns • Flowering plants • Land birds • Darwin’s finches Archipelago maps & displays of island information.
Data Resources:Darwin’s Finch Species Information • Pictures • Plumage descriptions • Foraging method • Foraging habitat • Breeding habitat • Breeding status on islands Diagrams of ------------------------------------------------- • Lateral view of skull, musculature • Ventral views of skull, musculature • Hard palate • Beak cross–section Display of a species’ information.
Data Resources:Molecular Sequences Display of a GenBank sequence. Sequence Name No. Sequences --------------------------------------------------------------------------------------------------------------------------------------------------------------- -------------------------------------------------------- • 16S Ribosomal RNA gene (partial) 16 • Mitochondrial Control Region (short) 12 • Microsatellite Repeat Region 16 • Cytochrome b protein 33 • Cytochrome b gene (partial) 40 • Mitochondrial Control Region (partial) 56 • Major Histocompatibility C Class II gene 40
Data Resources:Specimen Morphology Help screen showing measurements. Snodgrass Lack & Heller Sulloway Swarth ----------------------- ------------------------------------- ---------------------------------- ----------------------------- No. specimens 6,758 549 51 75 Island, sex, orig. & modern taxon name Plumage Beak height Beak width Upper beak length
Data Resources:Specimen Morphology(cont.) Display of measurements. Snodgrass Lack & Heller Sulloway Swarth ----------------------- ------------------------------------- ---------------------------------- ----------------------------- Nostril–upper beak l. Lower beak length Body length Tail length Wing length Tarsus length Middle toe & claw l.
Data Resources:Vocalizations Help screen describing graphic display of a vocalization 13 vocalizations --------------------------------------------------------------------- • Playable sounds • Sonograms • Waveform diagrams • Species descriptions Display of a vocalization (upper left), with expanded views of its components.
Data Resources:Weather Monthly weather data were exported to a statistics program to produce these graphs of rainfall over time and rainfall per month. El Nino events are readily visible.. • Island, station location • Elevation Monthly Averages (11 stations) --------------------------------------------------------------------------------------------------------------------------- • Precipitation • Temperature • Maximum temperature • Minimum temperature • Sea temperature • Hours of sunlight Monthly Data (one station, 1950–1989) ---------------------------------------------------------------------------------------------------------------------------------------------------------- • Year • Month • Total precipitation
Data Resources:Bibliography • 320 References, searchable by • Author • Title • Citation • Type of reference (8 types)
Data Resources:Pictures & Panoramas Image of an organism. • 12 Habitat panoramas (all major habitat types) • 16 Organisms/scenes Panorama of a habitat. Help screen describing panorama displays and their controls.
Data Resources:Tourist Visits (1979–1997) • Year • Month • Number of tourists
BIRDD’s Main Table of Contents This is one of BIRDD’s help screen and describes the main table of contents.
Example of Exported Data Opened with a Statistics Program
Example of Exported Data Scatterplot Matrix: All Species, All Islands
Example of Exported Data G. difficilis: Density Contour Plot for each Island Darwin, Wolf Santiago, St. Cruz Pinta, Genoveas
Example of Exported Data G. difficilis: Density Contour Plot for Samples All Islands
Example of Exported Data G. fuliginosa: Morphology Measures by Number of Species per Island