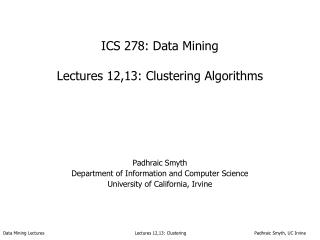
ICS 278: Data Mining Lectures 12,13: Clustering Algorithms
660 likes | 1.08k Vues
ICS 278: Data Mining Lectures 12,13: Clustering Algorithms. Padhraic Smyth Department of Information and Computer Science University of California, Irvine. Clustering. “automated detection of group structure in data”

ICS 278: Data Mining Lectures 12,13: Clustering Algorithms
E N D
Presentation Transcript
ICS 278: Data MiningLectures 12,13: Clustering Algorithms Padhraic Smyth Department of Information and Computer Science University of California, Irvine Data Mining Lectures Lectures 12,13: Clustering Padhraic Smyth, UC Irvine
Clustering • “automated detection of group structure in data” • Typically: partition N data points into K groups (clusters) such that the points in each group are more similar to each other than to points in other groups • descriptive technique (contrast with predictive) • for real-valued vectors, clusters can be thought of as clouds of points in p-dimensional space Data Mining Lectures Lectures 12,13: Clustering Padhraic Smyth, UC Irvine
References • Chapter 9 (sections 9.3 through 9.6) in the text • Algorithms for Clustering Data, A. K. Jain and R. C. Dubes, 1988, Prentice Hall. (a bit outdated but has many useful ideas and references on clustering) • Cluster Analysis (4th ed), B. S. Everitt, S. Landau, and M. Leese, Arnold Publishers, 2001 (broad overview of clustering methods) • How many clusters? which clustering method? answers via model-based cluster analysis, C. Fraley and A. E. Raftery, the Computer Journal, 1998. (good overview article on probabilistic model-based clustering, available from class Web page) Data Mining Lectures Lectures 12,13: Clustering Padhraic Smyth, UC Irvine
Clustering Data Mining Lectures Lectures 12,13: Clustering Padhraic Smyth, UC Irvine
Why is Clustering useful? • “Discovery” of new knowledge from data • Contrast with supervised classification (where labels are known) • Long history in the sciences of categories, taxonomies, etc • Can be very useful for summarizing large data sets • For large n and/or high dimensionality • Applications of clustering • Clustering of documents produced by a search engine • Segmentation of customers for an e-commerce store • Discovery of new types of galaxies in astronomical data • Clustering of genes with similar expression profiles • Cluster pixels in an image into regions of similar intensity • …. many more Data Mining Lectures Lectures 12,13: Clustering Padhraic Smyth, UC Irvine
General Issues in Clustering • Clustering algorithm = Representation + Score + Optimization • Cluster Representation: • What types or “shapes” of clusters are we looking for? What defines a cluster? • Score: • A clustering = assignment of n objects to K clusters • Score = quantitative criterion used to evaluate different clusterings • Optimization and Search • Finding the optimal (minimal/maximal score) clustering is typically NP-hard • Greedy algorithms to optimize the score are widely used • Other issues • Distance function, D[x(i),x(j)] critical aspect of clustering, both • distance of individual pairs of objects • distance of individual objects from clusters • How is K selected? • Different types of data • Real-valued versus categorical • Attribute-valued vectors vs. n2 distance matrix Data Mining Lectures Lectures 12,13: Clustering Padhraic Smyth, UC Irvine
Different Types of Clustering Algorithms • partition-based clustering • e.g. K-means • probabilistic model-based clustering • e.g. mixture models [both of the above work with measurement data, e.g., feature vectors] • hierarchical clustering • e.g. hierarchical agglomerative clustering • graph-based clustering • E.g., min-cut algorithms[both of the above work with distance data, e.g., distance matrix] Data Mining Lectures Lectures 12,13: Clustering Padhraic Smyth, UC Irvine
Partition-Based Clustering • input: n data points X={x(1) … x(n)} • output: C = {C1 … CK} = specification of K clusters • implicit representation: • each x(i) is assigned to a unique Cj (hard-assignment) • explicit representation • each Cj is specified in some manner, e.g., as a mean or a region in input space • Optimization algorithm • require that score[C] is minimized (or maximized) • e.g., sum-of-squares of within cluster distances • exhaustive search is intractable • combinatorial optimization problem: assign n objects to K classes • large search space: number of possible clusterings is approximately Kn/ K! • so, use greedy iterative method • will be subject to local maxima Data Mining Lectures Lectures 12,13: Clustering Padhraic Smyth, UC Irvine
Score Functions for Partition-Based Clustering • want compact clusters • minimize within cluster distances wc(C) • want different clusters far apart • maximize between cluster distances bc(C) • given cluster partitioning C, find centers c1…cK • e.g. for vectors, use centroids of points in cluster Ci • ci = 1/(ni) x Cix • wc(C) = sum-of-squares within cluster distance (minimize) • wc(C) = i=1…k wc(Ci) = i=1…k x Ci d(x,ci)2 • bc(C) = distance between clusters (maximize) • bc(C) = i,j=1…k d(ci,cj)2 • Can define scores as combinations, i.e., score[C]=f[wc(C),bc(C)] • See discussion on pp 297-300 in text Data Mining Lectures Lectures 12,13: Clustering Padhraic Smyth, UC Irvine
K-means Clustering • basic idea: • Score = wc(C) = sum-of-squares within cluster distance • start with randomly chosen cluster centers c1 … cK • repeat until no cluster memberships change: • assign each point x to cluster with nearest center • find smallest d(x,ci), over all c1 … cK • recompute cluster centers over data assigned to them • ci = 1/(ni) x Ci x • algorithm terminates (finite number of steps) • Score(C) at each iteration (if membership changes) • converges to at least a local minimum of Score(C) • not necessarily the global minimum … • different initial centers (seeds) can lead to diff local minima Data Mining Lectures Lectures 12,13: Clustering Padhraic Smyth, UC Irvine
K-means Complexity • time complexity = O(I e n K) << exhaustive ~ Kn/ K! • I = number of interations (steps) • e = cost of distance computation (e=p for Euclidean dist) • Approximations/speed-up tricks for very large n • use x(i)’s nearest to means as cluster centers instead of actual mean • reuse of cached dists from size n2 dist mat D (lowers effective “e”) • “condense”: reduce “n” by replacing group with prototype • Additional references: • D. Pelleg and A. Moore, Accelerating Exact k-means Algorithms with Geometric Reasoning, ACM SIGKDD Conference, 1999. • C. Elkan, Using the Triangle Inequality to Accelerate k-means. In Proceedings of the Twentieth International Conference on Machine Learning (ICML'03), 2003. Data Mining Lectures Lectures 12,13: Clustering Padhraic Smyth, UC Irvine
K-means • Ask user how many clusters they’d like. (e.g. K=5) • (Example is courtesy of Andrew Moore, CMU) Data Mining Lectures Lectures 12,13: Clustering Padhraic Smyth, UC Irvine
K-means • Ask user how many clusters they’d like. (e.g. K=5) • Randomly guess K cluster Center locations Data Mining Lectures Lectures 12,13: Clustering Padhraic Smyth, UC Irvine
K-means • Ask user how many clusters they’d like. (e.g. K=5) • Randomly guess K cluster Center locations • Each datapoint finds out which Center it’s closest to. (Thus each Center “owns” a set of datapoints) Data Mining Lectures Lectures 12,13: Clustering Padhraic Smyth, UC Irvine
K-means • Ask user how many clusters they’d like. (e.g. k=5) • Randomly guess k cluster Center locations • Each datapoint finds out which Center it’s closest to. • Each Center finds the centroid of the points it owns Data Mining Lectures Lectures 12,13: Clustering Padhraic Smyth, UC Irvine
K-means • Ask user how many clusters they’d like. (e.g. k=5) • Randomly guess k cluster Center locations • Each datapoint finds out which Center it’s closest to. • Each Center finds the centroid of the points it owns • New Centers => new boundaries • Repeat until no change Data Mining Lectures Lectures 12,13: Clustering Padhraic Smyth, UC Irvine
Image K-means clustering of RGB (3 value) pixel color intensities, K = 11 segments (from David Forsyth, UC Berkeley) Data Mining Lectures Lectures 12,13: Clustering Padhraic Smyth, UC Irvine
Image Clusters on color K-means clustering of RGB (3 value) pixel color intensities, K = 11 segments (from David Forsyth, UC Berkeley) Data Mining Lectures Lectures 12,13: Clustering Padhraic Smyth, UC Irvine
Issues in K-means clustering • Simple, but useful • tends to select compact “isotropic” cluster shapes • can be useful for initializing more complex methods • many algorithmic variations on the basic theme • e.g., in signal processing/data compression is similar to vector-quantization • Choice of distance measure • Euclidean distance • Weighted Euclidean distance • Many others possible • Selection of K • “screen diagram” - plot SSE versus K, look for “knee” of curve • Limitation: may not be any clear K value Data Mining Lectures Lectures 12,13: Clustering Padhraic Smyth, UC Irvine
Finite Mixture Models Data Mining Lectures Lectures 12,13: Clustering Padhraic Smyth, UC Irvine
Finite Mixture Models Data Mining Lectures Lectures 12,13: Clustering Padhraic Smyth, UC Irvine
Finite Mixture Models Data Mining Lectures Lectures 12,13: Clustering Padhraic Smyth, UC Irvine
Finite Mixture Models Data Mining Lectures Lectures 12,13: Clustering Padhraic Smyth, UC Irvine
Finite Mixture Models Weightk ComponentModelk Parametersk Data Mining Lectures Lectures 12,13: Clustering Padhraic Smyth, UC Irvine
Data Mining Lectures Lectures 12,13: Clustering Padhraic Smyth, UC Irvine
Data Mining Lectures Lectures 12,13: Clustering Padhraic Smyth, UC Irvine
Data Mining Lectures Lectures 12,13: Clustering Padhraic Smyth, UC Irvine
Interpretation of Mixtures 1. C has a direct (physical) interpretation e.g., C = {age of fish}, C = {male, female} Data Mining Lectures Lectures 12,13: Clustering Padhraic Smyth, UC Irvine
Interpretation of Mixtures 1. C has a direct (physical) interpretation e.g., C = {age of fish}, C = {male, female} 2. C is a convenient hidden variable (i.e., the cluster variable) - focuses attention on subsets of the data e.g., for visualization, clustering, etc - C might have a physical/real interpretation but not necessarily so Data Mining Lectures Lectures 12,13: Clustering Padhraic Smyth, UC Irvine
P d Probabilistic Clustering: Mixture Models • assume a probabilistic model for each component cluster • mixture model: f(x) = k=1…K wk fk(x;k) • wk are K mixing weights • 0 wk 1 and k=1…K wk = 1 • where K component densities fk(x;k) can be: • Gaussian • Poisson • exponential • ... • Note: • Assumes a model for the data (advantages and disadvantages) • Results in probabilistic membership: p(cluster k | x) Data Mining Lectures Lectures 12,13: Clustering Padhraic Smyth, UC Irvine
Gaussian Mixture Models (GMM) • model for k-th component is normal N(k,k) • often assume diagonal covariance: jj = j2 ,ij = 0 • or sometimes even simpler: jj = 2 ,ij = 0 • f(x) = k=1…K wk fk(x;k) with k = <k , k> or <k ,k> • generative model: • randomly choose a component • selected with probability wk • generate x ~ N(k,k) • note: k & k both d-dim vectors Data Mining Lectures Lectures 12,13: Clustering Padhraic Smyth, UC Irvine
Learning Mixture Models from Data • Score function = log-likelihood L() • L() = log p(X|) = log H p(X,H|) • H = hidden variables (cluster memberships of each x) • L() cannot be optimized directly • EM Procedure • General technique for maximizing log-likelihood with missing data • For mixtures • E-step: compute “memberships” p(k | x) = wk fk(x;k) / f(x) • M-step: pick a new to maximize expected data log-likelihood • Iterate: guaranteed to climb to (local) maximum of L() Data Mining Lectures Lectures 12,13: Clustering Padhraic Smyth, UC Irvine
The E (Expectation) Step Current K clusters and parameters n data points E step: Compute p(data point i is in group k) Data Mining Lectures Lectures 12,13: Clustering Padhraic Smyth, UC Irvine
The M (Maximization) Step New parameters for the K clusters n data points M step: Compute q, given n data points and memberships Data Mining Lectures Lectures 12,13: Clustering Padhraic Smyth, UC Irvine
Complexity of EM for mixtures K models n data points Complexity per iteration scales as O( n K f(p) ) Data Mining Lectures Lectures 12,13: Clustering Padhraic Smyth, UC Irvine
Comments on Mixtures and EM Learning • Complexity of each EM iteration • Depends on the probabilistic model being used • e.g., for Gaussians, Estep is O(nK), Mstep is O(nKp2) • Sometimes E or M-step is not closed form • => can require numerical optimization or sampling within each iteration • Generalized EM (GEM): instead of maximizing likelihood, just increase likelihood • EM can be thought of as hill-climbing with direction and step-size provided automatically • K-means as a special case of EM • Gaussian mixtures with isotropic (diagonal, equi-variance) k‘s • Approximate the E-step by choosing most likely cluster (instead of using membership probabilities) • Generalizations… • Mixtures of multinomials for text data • Mixtures of Markov chains for Web sequences • + more • Will be discussed later in lectures on text and Web data Data Mining Lectures Lectures 12,13: Clustering Padhraic Smyth, UC Irvine
Data Mining Lectures Lectures 12,13: Clustering Padhraic Smyth, UC Irvine
Data Mining Lectures Lectures 12,13: Clustering Padhraic Smyth, UC Irvine
Data Mining Lectures Lectures 12,13: Clustering Padhraic Smyth, UC Irvine
Data Mining Lectures Lectures 12,13: Clustering Padhraic Smyth, UC Irvine
Data Mining Lectures Lectures 12,13: Clustering Padhraic Smyth, UC Irvine
Data Mining Lectures Lectures 12,13: Clustering Padhraic Smyth, UC Irvine
Data Mining Lectures Lectures 12,13: Clustering Padhraic Smyth, UC Irvine
Data Mining Lectures Lectures 12,13: Clustering Padhraic Smyth, UC Irvine
Data Mining Lectures Lectures 12,13: Clustering Padhraic Smyth, UC Irvine
Selecting K in mixture models • cannot just choose K that maximizes likelihood • Likelihood L() is always larger for larger K • Model selection alternatives: • 1) penalize complexity • e.g., BIC = L() – d/2 log n , d = # parameters (Bayesian information criterion) • Asymptotically correct under certain assumptions • Often used in practice for mixture models even though assumptions for theory are not met • 2) Bayesian: compute posteriors p(k | data) • P(k|data) requires computation of p(data|k) = marginal likelihood • Can be tricky to compute for mixture models • Recent work on Dirichlet process priors has made this more practical • 3) (cross) validation: • Score different models by log p(Xtest | ) • split data into train and validate sets • Works well on large data sets • Can be noisy on small data (logL is sensitive to outliers) • Note: all of these methods evaluate the quality of the clustering as a density estimator, rather than with any explicit notion of clustering Data Mining Lectures Lectures 12,13: Clustering Padhraic Smyth, UC Irvine
Example of BIC Score for Red-Blood Cell Data Data Mining Lectures Lectures 12,13: Clustering Padhraic Smyth, UC Irvine
Example of BIC Score for Red-Blood Cell Data True number of classes (2) selected by BIC Data Mining Lectures Lectures 12,13: Clustering Padhraic Smyth, UC Irvine
Hierarchical Clustering • Representation: tree of nested clusters • Works from a distance matrix • advantage: x’s can be any type of object • disadvantage: computation • two basic approachs: • merge points (agglomerative) • divide superclusters (divisive) • visualize both via “dendograms” • shows nesting structure • merges or splits = tree nodes • Applications • e.g., clustering of gene expression data • Useful for seeing hierarchical structure, for relatively small data sets Data Mining Lectures Lectures 12,13: Clustering Padhraic Smyth, UC Irvine
Simple example of hierarchical clustering Data Mining Lectures Lectures 12,13: Clustering Padhraic Smyth, UC Irvine