Download
1 / 11
110 likes | 279 Vues
Food and Fuel: The Debate over Biofuels. Chad Hart chart@iastate.edu 515-294-9911 Ames Morning Rotary Ames, Iowa August 6, 2008. Department of Economics. Change in Food Price Indexes, 2005-2009. Item Final Final Final Forecast Forecast 2005 2006 2007 2008 2009

E N D
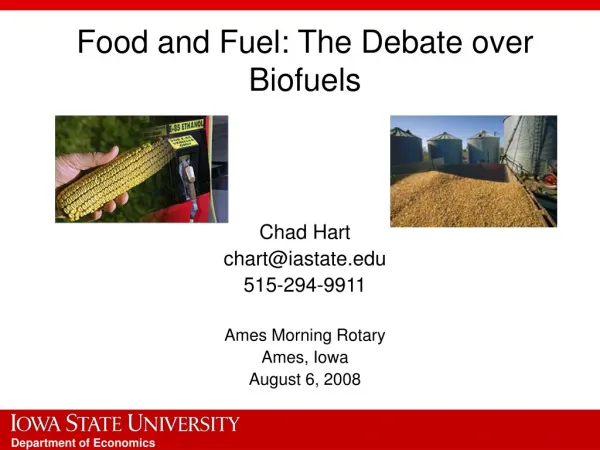
Food and Fuel: The Debate over Biofuels Chad Hart chart@iastate.edu 515-294-9911 Ames Morning Rotary Ames, Iowa August 6, 2008 Department of Economics
Change in Food Price Indexes, 2005-2009 Item Final Final Final Forecast Forecast 2005 2006 2007 2008 2009 Consumer price indexes Percent change All food 2.4 2.4 4.0 4.5 to 5.5 4.0 to 5.0 Food away from home 3.1 3.1 3.6 3.5 to 4.5 4.0 to 5.0 Food at home 1.9 1.7 4.2 5.0 to 6.0 4.0 to 5.0 Meats, poultry, and fish 2.4 0.8 3.8 2.0 to 3.0 5.0 to 6.0 Eggs -13.7 4.9 29.2 13.5 to 14.5 2.5 to 3.5 Dairy products 1.2 -0.6 7.4 7.0 to 8.0 4.0 to 5.0 Fats and oils -0.1 0.2 2.9 11.5 to 12.5 3.0 to 4.0 Fruits and vegetables 3.7 4.8 3.8 4.5 to 5.5 3.5 to 4.5 Sugar and sweets 1.2 3.8 3.1 4.5 to 5.5 3.0 to 4.0 Cereals and bakery products 1.5 1.8 4.4 9.0 to 10.0 3.5 to 4.5 Nonalcoholic beverages 2.9 2.0 4.1 3.5 to 4.5 3.0 to 4.0 Other foods 1.6 1.4 1.8 3.5 to 4.5 3.0 to 4.0 Sources: Bureau of Labor Statistics and USDA-Economic Research Service Department of Economics
The U.S. Food Dollar Source: USDA-Economic Research Service, 2008 Department of Economics
Farm to Retail Food Price Spread Source: USDA-Economic Research Service, 2001 Department of Economics
U.S. Ethanol Production Source: Renewable Fuels Association Department of Economics
Corn Prices Source: CBOT Department of Economics
Crude Oil Prices Source: U.S. Dept. of Energy, Energy Information Administration Department of Economics
Population Source: U.S. Bureau of the Census, International Data Base Department of Economics
Real GDP Sources: International Financial Statistics, Global Insight Department of Economics
Countries Pursuing Biofuels • US • Brazil • Argentina • Colombia • Paraguay • Canada • Uruguay • Mexico • Thailand • New Zealand • South Africa • South Korea • Philippines • Indonesia • Pakistan • China • India • Malaysia • Australia • Japan • EU • Russia • Not a complete list Department of Economics
List of Reasons • Long run trends in agricultural production and usage • Global demand for biofuels • Reduced production in some areas of the world (droughts, floods, etc.) • Weaker U.S. dollar • Higher energy prices • Increased cost of agricultural and food production • Protectionist policies adopted by some countries Department of Economics