
Uploaded by
onawa
1 SLIDES
137 VUES
10LIKES
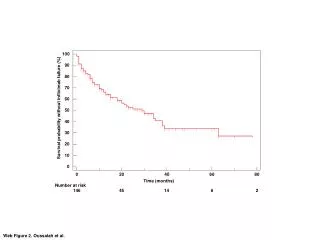
Survival Probability Without Infliximab: A Time-Based Analysis
DESCRIPTION
This graphic illustrates the survival probability percentages over time (in months) for patients not receiving Infliximab treatment after failure. The data suggests a declining survival rate as time progresses, providing crucial insights into the outcomes for patients post-treatment. With a number at risk highlighted at various time points, this figure sheds light on the implications of treatment choices in clinical settings. The research conducted by Oussalah et al. emphasizes the importance of understanding patient survival probabilities.
Download
1 / 1
Télécharger la présentation 
Survival Probability Without Infliximab: A Time-Based Analysis
An Image/Link below is provided (as is) to download presentation
Download Policy: Content on the Website is provided to you AS IS for your information and personal use and may not be sold / licensed / shared on other websites without getting consent from its author.
Content is provided to you AS IS for your information and personal use only.
Download presentation by click this link.
While downloading, if for some reason you are not able to download a presentation, the publisher may have deleted the file from their server.
During download, if you can't get a presentation, the file might be deleted by the publisher.
E N D
Presentation Transcript
100 90 80 70 60 Survival probability without infliximab failure (%) 50 40 30 20 10 0 0 20 40 60 80 Time (months) Number at risk 146 45 14 6 2 Web Figure 2. Oussalah et al.


More Related