Download

1 / 9
90 likes | 239 Vues
This document outlines the procedure for measuring Polarisation Mode Dispersion (PMD) using the FTB-400 mainframe with GP-407 and the FTB-5500B PMD analyzer. It details the necessary equipment requirements, including the FLS-5800 series CD/PMD source, and provides a step-by-step guide for setup, measurement, and analysis. Key steps include powering up equipment, connecting patch-cords, selecting wavelength ranges, and conducting tests to ensure accurate results. The output includes critical parameters such as PMD delay and coefficient.

E N D
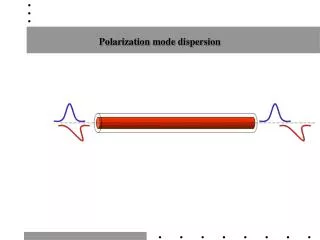
Polarisation Mode Dispersion Measurement Piotr Turowicz Poznan Supercomputing and Networking Center piotrek@man.poznan.pl Kiev 9-10 October 2006
Equipment requirements. FTB-400 mainframe equipped with GP-407. FTB-5500B PMD analyzer FLS-5800-xx series CD/PMD source Toolbox office software 6.21 or higher installed on FTB-400
Step 1. The FLS-5800 series source should be powered-up and allowed to complete its self test routine (less than 30 seconds). The user then has to select wavelength range and then activate the source. C band (nominally 1510 to 1560nm) and C+L band (nominally 1510 to 1610nm). Step 2. Inspect and clean the connectors on the appropriate patch-cord and connect to the source. Step 3. Power-on the FTB-400 and activate the FTB-5800 Step 4. Connect the patch-cord to the input on the FTB-5800 analyser module.
Connecting and taking a measurement Step 1. The FLS-5800 series source should be powered-up and allowed to complete its self test routine. The user then has to select wavelength range and then activate the source. There are two options: C band (nominally 1510 to 1560nm) and C+L band (nominally 1510 to 1610nm). Step 2. Power-on the FTB-400 and activate the FTB-5500B PMD analyser software. Step 3. Inspect and clean the connectors on the appropriate patch-cord and connect to the source.
Connecting and taking a measurement • Step 5. • Check the input power level on the analyzer software. This is a basic Go/No Go indication to indicate if useable power is present before starting. This will save you time in your testing as it will indicate whether: • · your source is truly activated, • if you are connected to the correct fibre (a common problem!) • and can potentially tell you to use longer averaging times (if the source signal is low)
Connecting and taking a measurement Step 8 In Fiber Parameters enter the length of the link in km, select fibre type and select the wavelength range to match your FLS-5800 source settings: The usual settings are either C+L band or O, C & L. Check the display of the FLS-5800 series source to verify.
Connecting and taking a measurement Step 10 To begin a measurement, press the GREENstart button. The software automatically switches to the Results Graph screen. Note - This screen shot shows the typical data AFTER acquisition has finished and the data analysed.
Connecting and taking a measurement Step 11 The output of the measurement gives the resultant interferogram, the PMD Delay in [ps] and the PMD Coefficient in [ps/Sqrt_km]. Additional information included in the output includes 2nd Order PMD, Length of sample and Wavelength range over which measurement has been performed.